Here is an extremely telling chart:
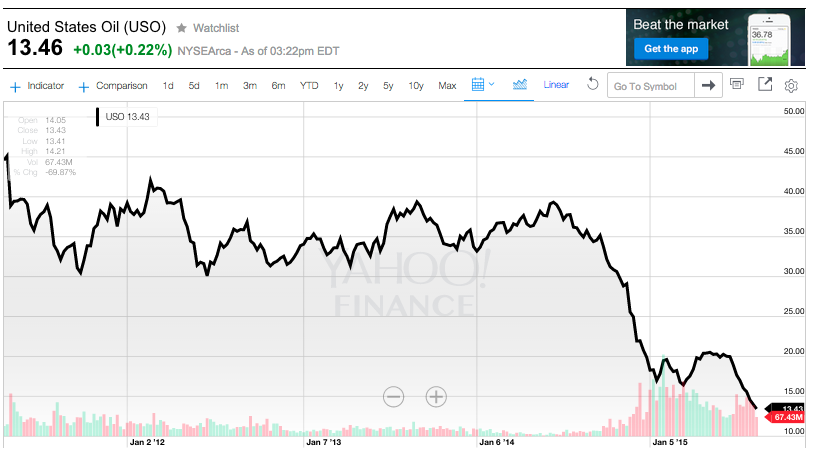
This chart shows the price of USO from the spring of 2011 into midyear of 2015.
This chart of the United States Oil ETF (USO) [designed to reflect the price movement of oil futures] between the spring of 2011 and August of 2015 tells us a tale that most investors would have labeled as a “Whopper” if some would-be storyteller had predicted it in writing back in 2011! Here are the intermediate “highs” in USO between April of 2011 and August of 2015:
$45.35 on April 25, 2011
$42.07 on Feb. 20, 2012
$39.54 on Sept. 2, 2013
$39.44 on June 16, 2014
$21.50 on May 6, 2015
On the day I am writing this (August 20) the high of the day stood at $13.70.
In the interest of full disclosure, I am not a trained psychologist. However, I have come to feel that the reason so many investors have been caught by surprise (and many have been hurt by) the precipitous fall in the price of oil (as represented by USO) from mid-2014 into the current period… relieved only by a limited “Oasis” of recovery between January 28th ($16.50) of this year into the May high ($21.50) … rests in a form of Cognitive Dissonance.
In trading, most of us are familiar with what usually happens when a stretch of new price highs on a chart is not confirmed by underlying technical signals (be it relative strength, on balance volume, money flow, etc.) – namely, price often rolls over.
A similar struggle goes on within the mind of the average trader when what one sees on a chart conflicts with psychological biases that we have mentally accepted as “true” (consciously or subconsciously). There are at least four powerful biases that I have seen at work with regard to oil during the past two years:
1) Recency Bias: this is our innate tendency to extrapolate recent trends/events into the future … often indefinitely. This bias can be documented based on past surveys of market advisers regarding market direction. In the aggregate, the highest recommended allocation to equities has tended to come just as the peak of that market cycle has been reached (a memorable example being the spring of 2001, at the peak of the “Dot.com” bubble).

Recency Bias is just one of many ways in which our brain functions in ways that often create unhelpful biases within us as we view the world around us.
2) Confirmation Bias: in an ideal world, we would approach each new analytical issue with a totally open mind (“tabula rasa”).

This painting is: “Sybil with Tabula Rasa” by Diego Velazquez (1648). “Tabula Rasa” means “Blank Slate”.
Then, based upon the metrics involved and other facts we uncover, we would draw a conclusion. However, perhaps you’ve noticed that human beings tend to approach analytical issues with at least a few preconceptions (biases) – including Recency Bias. Unfortunately, we tend to then latch on to those metrics, facts, and opinions (from credible sources) that substantiate our preconceptions.
3) Preference for “Stories” over “Analysis”:
Surely you’ve noticed within media outlets such as CNBC that the preponderance of content that gets broadcast is a mixture of opinions and stories, with little true analysis going beyond two or three bullet points. In fact, most of the CNBC content during the past couple of years has cycled (endlessly) around topics that a truly honest observer would consider unanswerable (short of having insider knowledge) – ie. when will the Fed raise rates and what will be the next development within the seemingly endless Greek Debt Crisis(besides it getting worse)[1].

Which is more likely to capture of attention of TV viewers -- a great STORY by an exceptional story-teller such as Orson Welles (his "War of the Worlds" radio broadcast in 1938 received national attention and became enshrined in U.S. broadcast annals)... OR
... a broadcast regarding a detailed ANALYSIS such as the above?
There is one, simple, overriding reason for that fact! “Stories and Opinions” capture the attention and time (eyes) of viewers – which maximizes what CNBC can charge for commercials. Deep analysis does not capture nearly as many viewers. CNBC is responsible for maximizing its profit (the monetization of its content) – therefore, we get fed opinions and stories all day long. We like the opinions and stories that confirm our own biases; we become uneasy at those stories or opinions that conflict with our biases. But we usually manage to hold on to the stories we like and ignore the ones we don’t!
4) Optimism Bias: humans have an amazing aptitude for maintaining confidence in their own judgment … even in the face of our too frequently finding ourselves at the “losing end” of a trade (or a prediction). In the aggregate, our (collective) level of self-confidence and self-perception would result in a “Confidence Metric” that would lead a totally objective observer to conclude that we must all live in “Lake Wobegon”[2].

Let me briefly summarize how these biases have conspired within many of us to shape our perception about the price of oil in dysfunctional ways:
1) Prior to mid 2014… the “oil price” most often quoted hovered around the $100/barrel mark.
a) Whenever it would spike, we’d get reports about gasoline prices going over $4/gallon… and how that would hurt SUV’s and help Elon Musk’s Tesla (TSLA).
b) Occasionally, someone would even resurrect the “Peak Oil” story.
c) The chronic tension between OPEC and the West added another “layer” of emotion onto $100/barrel oil.
d) We became so used to oil at that price that it became “set” within our heads because of Recency Bias.
2) Therefore, as we contemplated future oil prices, we tended to latch onto stories that would support that price….
a) This tendency was reinforced by the recurring pattern within OPEC with regard to the periodic setting of oil production quotas.
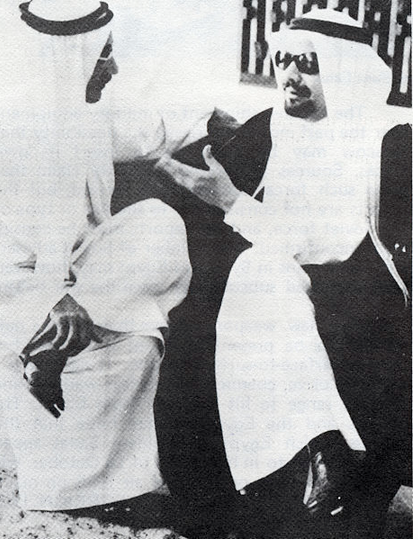
Here is a photo of Oil Ministers from OPEC nations meeting to set oil production quotas. This photo is from the early 1970's, when we first started seeing such photos regularly.
i) Everyone knew that some members of OPEC would “cheat” (produce oil in quantities higher than stipulated). This was a “given” as sure and certain as the sun rising in the East.
ii) Historically, each cartel has to have a leader. A primary function of that leader is to maintain a “flexible” production policy that adjusts (usually downward) to reverse the ill impact on price resulting from overproduction by the (inevitable) cheaters. Saudi Arabia has been the long-time leader within OPEC … and consistently, for decades, it adjusted its own production in order to stabilize oil prices to maintain a profitable market.
iii) That behavior pattern by Saudi Arabia became part of our Recency Bias.
3) Confident in our understanding of “the Market” … and of our own sound judgment and analytical skills… and continually latching on to those stories and opinions that supported our on way of thinking… most investors laughed when economist Gary Schilling predicted in February of this year that oil could continue falling to $10-20/barrel.
a) When oil prices stabilized by February of this year and started (slowing) moving up into the $50’s and beyond… guess what happened? [End of January through middle of May.]
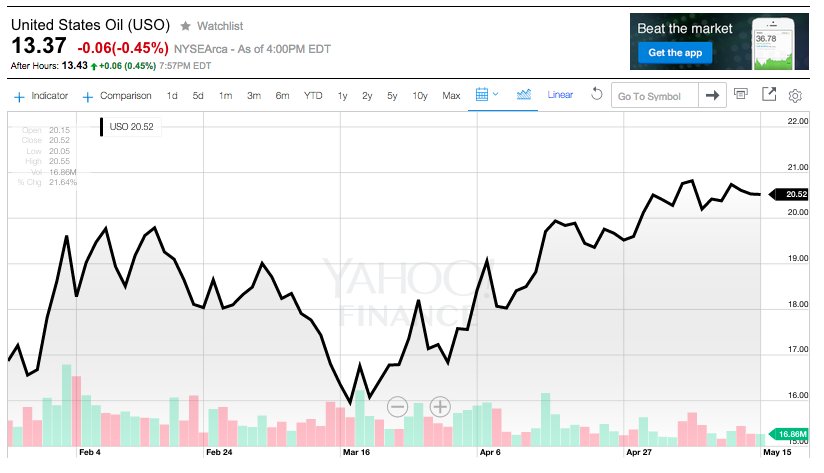
b) Lots of investors breathed a sigh of relief… some thought to themselves “See, Schilling was wrong!”… and others actually believed it might go back to $80 (the global average price for oil production).
c) Stories and opinions on CNBC began to focus on the idea of stable to higher oil prices… and for many, that sounded just fine!
d) Alas, so-called “bargain hunters” in the industry, tempted by historically low interest rates and the prospect of rising oil, actually proceeded to raise $11 billion in new equity capital for exploration and production. [How is that looking now?]
So here we are… uncertain precisely where the price of oil is heading… but absolutely certain that the question itself is a whole lot more complicated, with a lot more potential unknown impacts upon the global economy, than it was two years ago!!
And as long as I have touched upon the “impact upon the economy” question – allow me to remind us how complicated even that matter can be!! Specifically, I ask you to recall the countless financial observers who virtually guaranteed 10 months ago that we would see a significant bump up in consumer buying activity because gasoline pump prices had fallen by half – leaving much more cash in the wallets of consumers… who would be ready to spend! Pardon me, but that is not what happened! So much for the “experts”.
Where did those who were caught “long” on oil (before or now) go wrong? Those folks fell victim to these widespread, thorny, dysfunctional biases! Biases become quite costly whenever the underlying situation changes significantly… and to say that the “Oil Patch” has changed is a drastic understatement:
1) The uncovering of massive oil resources in North America has been a total game changer!
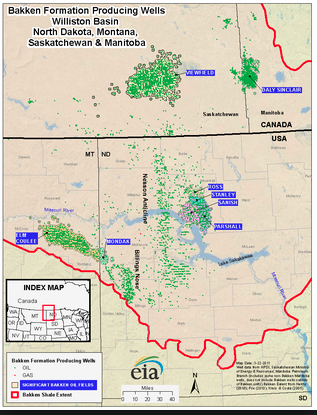
The Bakken Formation surrounding North Dakota is one example of the great North American Energy Boom
2) From the perspective of Saudi Arabia, it was one thing to serve as the sacrificial OPEC “leader” when the beneficiaries of its sacrifice were (mostly) a part of OPEC. Once the list of beneficiaries of Saudi production cuts (and oil price stability) expanded to North America and included countries with which the Saudis do not have affection (eg. Russia), they became fed up!
a) Therefore, Saudi Arabia entered into economic warfare to curtail production beyond OPEC… knowing that its cost of production was among the lowest in the world (if not literally the lowest).
b) Add to that the fact that the Saudis are tired of being taken advantage of by the “cheaters” (and is not fond at all of the very next oil exporter likely soon to come on board (if the U.S. confirms the “Iranian Nuclear Deal”). The Saudis know that it can withstand lower prices longer than the oil production “cheaters” can!
c) As a result, the Saudis are producing a record 10.35 million barrels per day. And OPEC has no set quota (its latest production was the highest since mid-2012).
3) What should we look for? No one can possibly know all the factors that will prove to be the drivers of future oil prices… but here are a few key factors:
a) A base price for oil production can be ascertained by reviewing the price it costs to produce a barrel of oil once it is found, the well(s) drilled, pipelines are in place, and overhead costs are covered.
b) In terms of Economics 101, that is the price at which cash flow from the next barrel of oil becomes zero.
i) That “marginal cost” ranges between $10 to $20/barrel in the Texas Permian Basin and in the Persian Gulf.
c) That price is distinctly different than the price needed by any given country meet “the budget” (example: $40/barrel in Kuwait; $125/barrel in Venezuela).
d) Another price projected by OPEC is that which would allow oil projects in North Dakota to remain profitable – a number OPEC pegs between $24 and $41/barrel.
e) OPEC projects that, during the second quarter, global oil output exceeded demand by almost 2.9 million barrels per day.
f) The International Energy Agency predicts that global demand will rise 1.6 million barrels per day this year, and 1.4 million barrels per day in 2016.
g) As mentioned above, if the U.S./Iran Agreement is finalized, Iran has enough oil in “floating tankers” to almost instantly add one-half million barrels per day to supply… stepping up output to as much as 1 million barrels per day.
h) Meanwhile, it would appear that Saudi Arabia is prepared to let production increase as high as needed to shake out higher cost producers, including (in particular) Russia and North America.
i) To complicate matters further, no one knows how great an impact China will have within this analysis:
a) Many see slowing growth
b The ongoing impact of its mainland stock market volatility
c) The devaluation of the Yuan.
I wish I could confidently offer a projection regarding the price of oil six months from now. Actually, I’d be pleased if I could confidently predict within what range oil prices would trade by next February! Unfortunately, all I can saw with confidence is the following
1) Oil supply far exceeds global demand.
2) The oil market has changed dramatically and will continue to change in the next few years ahead.
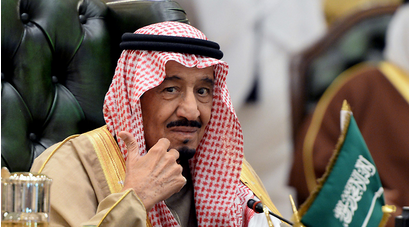
This is the king of Saudi Arabia, King Salman bin Abdulaziz Al Saud. He and his country are at the center of the "new" Politics of Oil. Decisions made by the king and his country will undoubtedly play a key role in how low the price of oil will go.
We can now longer let the biases that colored our market view as recently as a year ago have any sway in our analysis moving forward.
During the past 12 months, some analysts have reported data on the number of oil rigs taken out of service and used that data to project reductions in oil production. However, such analysis has not taken into consideration that modern oil rig technology allows "horizontal rigs" to produce more wells per rig even as "vertical rigs" go out of service!
3) CNBC is not a helpful source for detailed analysis on oil (or much of anything else). All one should hope to glean from it is what current market “hot buttons” might be… what emotional tone industry professionals might be projecting… and which stocks are being most heavily promoted at the moment.
4) Gary Schilling’s concept of $10-20/barrel oil, however scary it sounds, holds a bucket load more credibility with me now than it did in February! However, that doesn’t at all mean that I am preparing to trade oil with that assumption in mind! I am definitely in a “wait and see” mode – much less risky than any mode within which I might assumes that I “know more than the market!”[3]
INVESTOR TAKEAWAY
I hope the implication of all this is obvious to you. In my opinion, if Jiminy Crickett[4]

was helping you trade oil, he’d remind you to only trade when you had reason to believe a short to intermediate term trend was in force. And he would push you to always use some form of risk management stop, to spare you from getting run over by price volatility! Finally, he would remind you (whenever you took a bullish position, that “fundamentals” were pushing the price downward.
DISCLOSURE
It has been a long time since the author had a position in USO. Once he realized he was baffled by the details of the current details related to oil politics and the oil industry, he stopped trading it! Nothing in this article is intended as a recommendation to buy or sell anything. Always consult with your financial advisor regarding changes in your portfolio – either subtractions or additions.
FOOTNOTES:
[1] Recall how many experts nearly guaranteed us that a “Greek Exit” from the Euro would be a fiat accompli by now. Hmmm?
[2] “where all the women are strong, all the men are good-looking, and all the children are above average”
[3] A temptation into which I might fall only if I considered myself from Lake Wobegon – and therefore “above average”!
[4] A timeless and wise counsel to Walt Disney’s “Pinocchio” cartoon character – he focused especially on keeping Pinocchio safe!
Related Posts
 2 Artificial Intelligence (AI) Chip Stocks to Watch That Aren't Nvidia
Also on Market Tamer…


Follow Us on Facebook