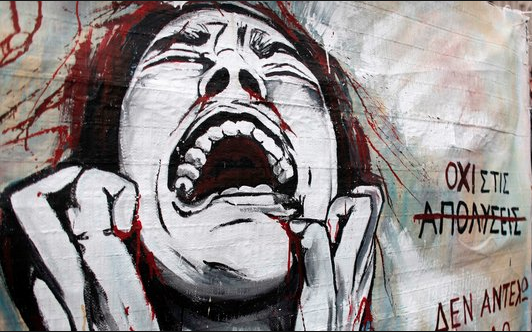
This is a poster from a 2012 protest in Greece regarding austerity and Greek Debt. For the U.S. investor tired of the continuing financial "drama", this facial expression could illustrate how frustrated and stressed investors become on "Fed Days" and when the "Greek Cycle" takes another turn for the worse.
Do you sometimes feel like investors are trapped in a variation on the iconic movie: “Groundhog Day”? Every month we go through the same news cycle on U.S. interest rates (“When will the Fed raise rates?”) and Greece (“Will Greece or won’t Greece (default on debt and/or exit the Eurozone)?). Isn’t it amazing how many experts and analysts the financial media can parade before us – each pronouncing (with seeming confidence) what we should expect in tomorrow’s news … and yet nothing (materially) changes.
If you don’t quite understand what I am driving at, let’s play an “Imagination Game”:
Imagine you are a modern day Rip Van Winkle[1] who “fell sleep” in November of 2011 and just woke up at the beginning of June of 2015! What would you remember from November 2011 and earlier?
1) QUANTITATIVE EASING (QE): The U.S. Federal Reserve was already deep into its Zero Interest Rate Policy (ZIRP). We had already been through two versions Ben Bernanke’s QE Policy… and “Operation Twist” was the newest “wrinkle”.
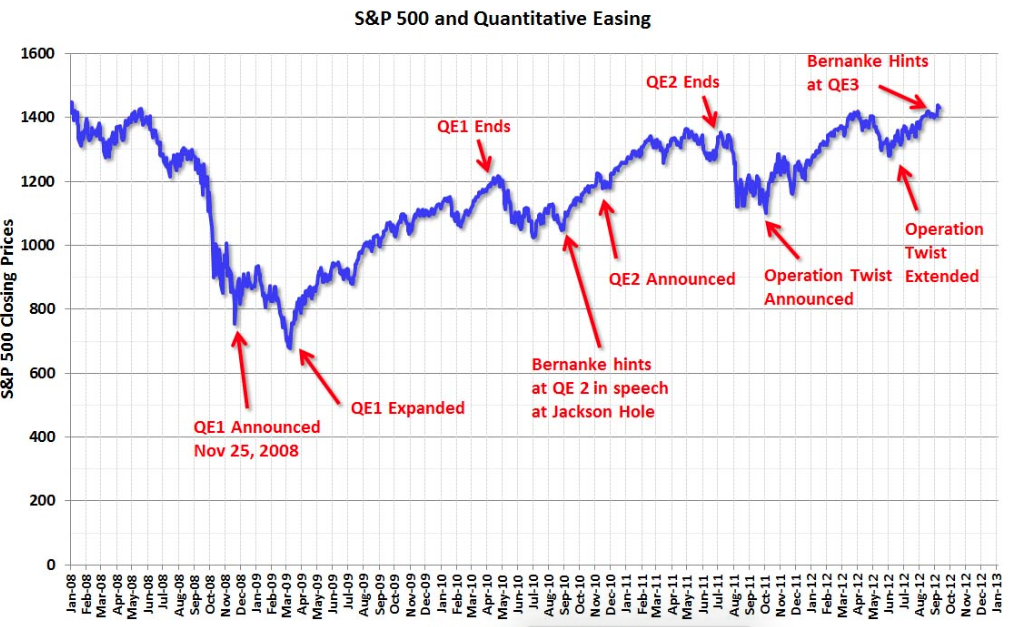
A timeline on Quantitative Easing through 2011
2) GREECE: Greece started on its course of cyclical financial crisis in 2010… and by November of 2011:
Standard & Poor’s had (for a second time) bestowed the lowest possible credit rating on Greek debt.
Parliament passed a “new” austerity package.
The Greek stock exchange reached its lowest level since the start of 1997. The government imposed a property tax to be assessed through electricity billings.
The government announced a “multi-austerity package”—which inspired public rioting.
Investors accepted a 50% “haircut” on their bonds – converting said bonds into new debt.
The Greek Prime Minister won a “confidence” vote… and soon thereafter resigned. You thought things couldn’t get any worse.
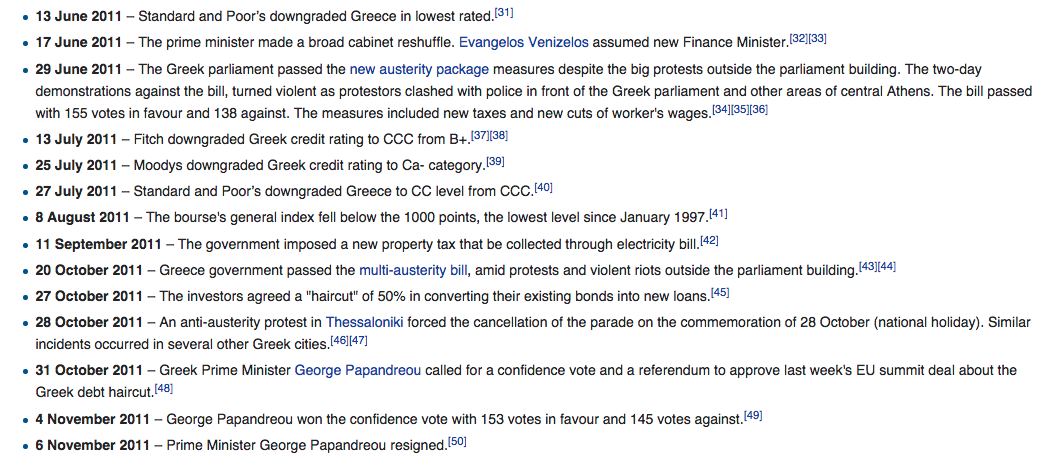
Greek Debt Timeline in 2011
3) U.S. Stocks: from early March of 2009 (the lowest low) through the end of November 2011 (just as you went to sleep), the S&P 500 Index had recovered almost 80% of its value in just 2.75 years. You thought you were “sitting pretty and doin’ fine”! (Except for Greece, of course).
4) Oh… and one more thing… J.P. Morgan Chase (JPM) had been assessed fines and penalties totaling almost $575 million during 2011 alone (between just June and August). The United Kingdom fined JPM for not adequately segregating customer accounts from bank funds; the SEC fined JPM for lack of disclosure in the sale of CDO’s and for fraudulently rigging multiple municipal bond transactions; but the violation you thought was most egregious was the overcharging of active members of the U.S. military on mortgages!
So now let’s “wake you up” on June 1st, 2015. What do you discover as you start “catching up”?
1) Quantitative Easing: at least for now, that is behind U.S. investors. But as though it was an infectious bacteria, you discover that QE has “spread” to Europe, to Japan, and (in a variation) to China (among others). That said, ZIRP remains in effect within the U.S. and every day, you hear the familiar refrain from the financial media: “When will the Fed raise rates?”
2) Greece: You can’t believe that the Greek drama is still in full flower! In addition, you discover how “wrong” you were in 2011! The “Greek Crisis” not only did get worse… it got much worse. In addition, knowing that the Greek economy is only equivalent in size to that of Dallas/Fort Worth … it dawns on you that something much bigger must be at stake. Indeed, you hear rumblings that “If Greece is allowed to leave the Eurozone…” there will be a line of countries ready to take the same step. That is the “true” issue at hand, and why Greek leaders have an illogical “leverage” over Eurozone politicians.
3) U.S. Stock Market: You look at a chart. You blink your eyes and shake your head in incredulity: “What?! It can’t be! This is insane!”
You see that the S&P 500 Index (with dividends reinvested) has gone up an additional 75%+ since November 30, 2011!! And you thought you had it made back in 2011!!! Little did you know.
4) J.P. Morgan Chase: Well, it takes a while for you to get “acclimated” to 2015.[2] But on the evening of June 16th, while you are enjoying a Guinness pint with a dear old friend in the local pub, that friend shows you a chart comparing JPM and the S&P 500 from when you first fell asleep through June 16th! You are flabbergasted that, as great as the S&P 500 has performed… the bank literally “smoked” the Index by jumping over 106% since November 2011!!
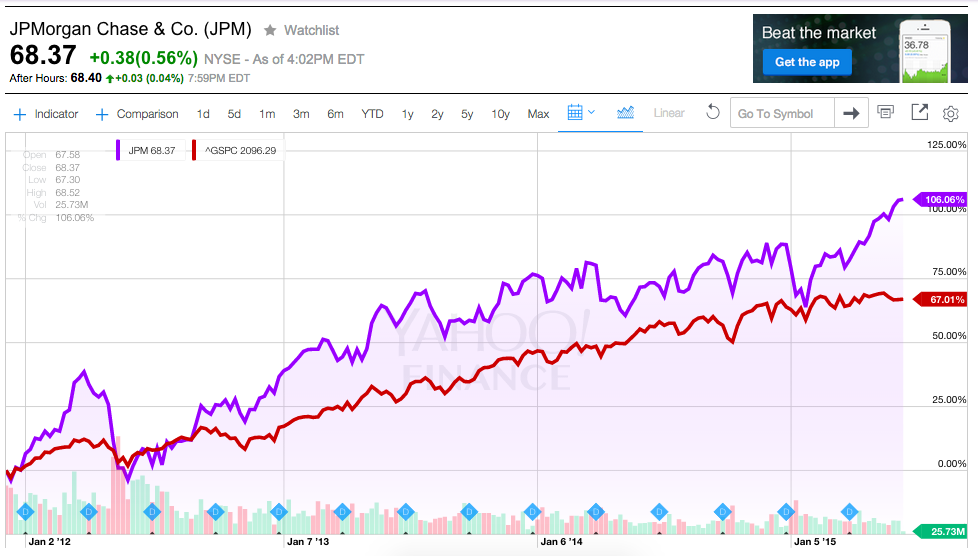
S&P 500 Index and JPM between the end of 2011 and June 16, 2015
You also notice a 3-month chart of the $19 billion market cap Select Sector Financial Select Str SPDR ETF (XLF) compared with the S&P 500 and JPM:
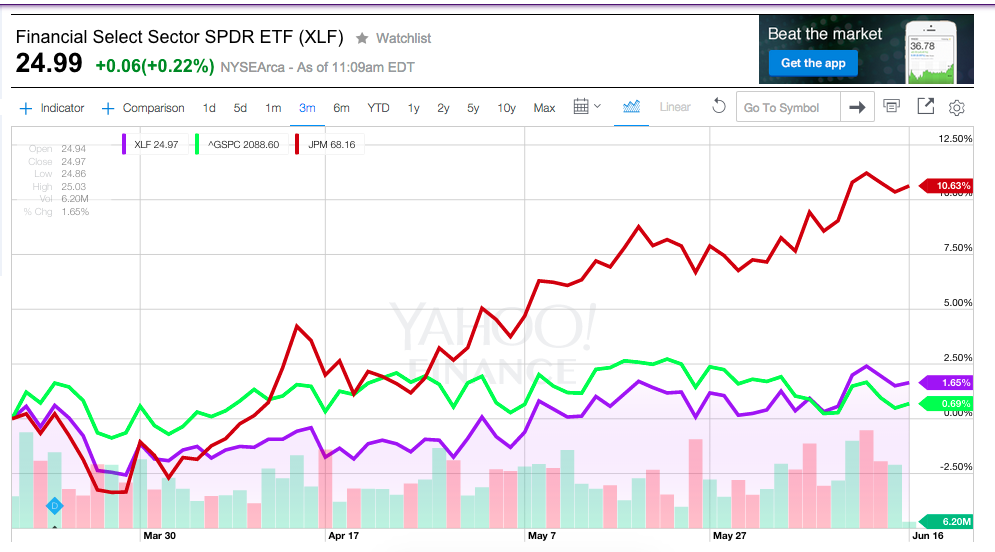
Most recent three months: XLF vs the S&P 500 and JPM
“Hmmm!” you think. “The XLF has been trailing the S&P 500 for most of the period… but has lately accelerated upward. The market must be expecting higher interest rates (favorable to financials).”
But what really impresses you is the outperformance of JPM during the period (up over 10.5%) vis-à-vis XLF (of which it is a key component) (up just over 1.5%).
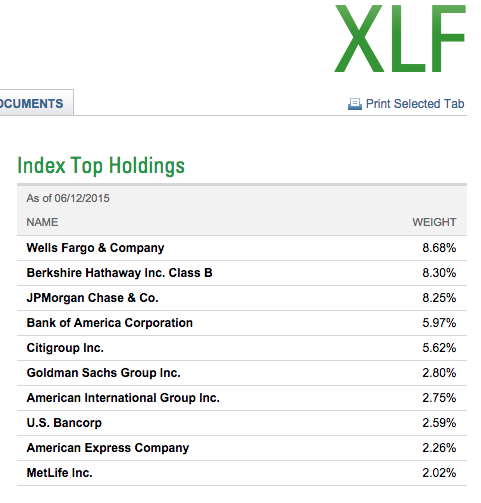
Top Ten Holdings in XLF. Note the ETF focuses on "big banks". JPM itself comprises over 8% of the ETF.
You are (of course) nothing but bold, honest, and transparent. Therefore, remembering your negative “vibes” about JPM from all those 2011 fines… you tell your friend:
“Wow. Jamie Dimon (JPM CEO) must be a frickin’ genius – turning around that behemoth bank and getting it to toe the line with the regulators!! If JPM were a “movie”, it would hands down be the top pick as an Academy Award Winner!”
Your friend instantly falls off his chair, laughing hysterically. In fact, he remains curled up in uncontrolled, boisterous laughter for quite a long time. And of course, all the folks around him want to know: “What’s so funny?”
So he tells them what you have just concluded about Jamie Dimon and JPM based on those stock charts. The result is that everyone in the pub breaks out in uproarious laughter! Of course, you are “left out” of the laughter; but you do receive a nice “consolation prize”: “free Guinness pints” for the rest of the evening!! [You evidently wound up being (quite unintentionally) the evening’s “entertainment.”]
Once the din (finally) dies down, your friend pulls an Excel spreadsheet up on his computer – summarizing the fines and penalties (and “clawbacks”) assessed against JPM from 2011 to January of 2014:
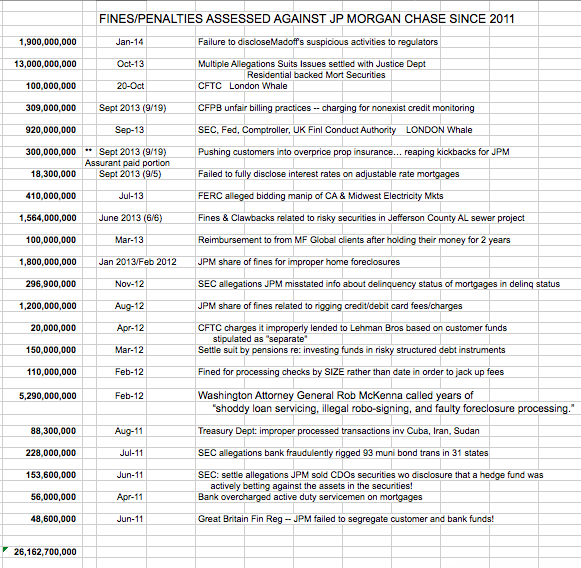
What immediately leaps out at you is the total at the bottom of the sheet. The sum of these fines has exceeded $26 billion!!! And here you thought that a mere $575 million was pretty horrible! [Foolish you.]
In a friendly attempt to help you gain a better “scale”, your drinking buddy points out that just $20 billion would adequately fund the education budget for New York City… or it would finance the payroll for the New York Yankees for a century (yes, even with A-Rod on board!!).
You are left overwhelmed by all of this data!! How is it that a company that has been found to be criminally liable – to the tune of over $26 billion – far outperforms the rest of the market over the course of 3.5 years?[3] And you ask yourself this question:
“If instead of JPM and Dimon, these 4 years of fines had been levied against Tim Cook and Apple (AAPL), Jeff Bezos and Amazon (AMZN), Reed Hastings and NFLX, wouldn’t those stocks have experienced serious negative consequence with regard to performance?”
Tim Cook is the CEO of Apple (AAPL)
But enough on all of that! Let’s return to our basic starting premise:
We are tired of the seemingly unending news recycling regarding the Fed and Greece.
So, let me pose to you a separate issue… an issue that is much more fundamental and systemic issue, and (I dare say) many degrees more significant than whether Greece secures another Euro Bailout … or whether U.S. Federal Reserve Chair, Janet Yellen, presses the “Interest Rate UP Button” this month, next month, next quarter, or next year!
“Is the U.S. Financial System more sound now, and on a firmer financial footing, than it was in 2007-2009?”
Quite frankly, during the past few years, as I have read analysts, commentators, and authors, what I recall as the pattern is that most of them boldly state that, “of course” the U.S. financial system is healthier than it was back then… as though that was some form of a priori or axiomatic knowledge!! Such unsubstantiated comments have yet to convince me.
For better or worse, more convincing to me have been recurring headlines regarding financial institutions and the periodic, trenchant, empirically-documented commentary offered by respected persons in a position to “know” the truth.
An example of such commentary can be found in remarks offered during May (2015) by Jeffrey Lacker, president of the Richmond Federal Reserve Bank (and a voting member this year on the Fed's policy-setting committee).

Jeffrey Lacker of the Richmond Federal Reserve Bank
Lacker shares concerns vocalized by a few other key experts regarding what regulators must do to ensure a “safer” financial system.
Lacker is absolutely certain that the “solution” does not rest within either:
1) the Fed's emergency lending powers and
2) Title II of the 2010 Dodd-Frank Wall Street Reform Act.
Instead, the ultimate (lasting) remedy for “too big to fail banks” is the restoration of “market discipline” – meaning a clear understanding that U.S. banks will rise or fail on their own. This means that the government must be willing to let firms fail. According to Lacker, that would be the most effective means of restoring market discipline. As a key corollary of this point, in Lacker’s opinion standing firm on that stance (in a credible fashion) would also be the best way to ensure that “financial firms and their creditors have an incentive to avoid fragile funding arrangements[4].”
Let’s review (briefly) Title II of Dodd-Frank:
That provision (the “Orderly Liquidation Authority” (OLA)) empowers the Federal Insurance Deposit Corp to draw upon the U.S. Treasury if/when a bank needs to be “liquidated”… in order to maintain bank activities until they are sold off or wound down.
According to Lacker: “Rather than ending ‘too big to fail’ the OLA replicates the dynamic that created it.”
Of course, the “emergency lending authority” of the Federal Reserve serves much the same purpose. Lacker has made no secret of his position (echoed by critics from both political parties) that this power should be repealed. He has also opined that the lending authority favors the biggest Wall Street firms.
Ultimately, Lacker contends that these “lending powers” encourage “risk-taking” by large Wall Street firms… and risk-taking increases the likelihood of a future financial crisis (and bailout).
Lacker doesn’t just pontificate… he and the Richmond Federal Reserve Bank he leads provide a wealth of information on “federal bailouts”.
I’ll spare you the granular detail, but here are the two big “visuals” that illustrate Lacker’s concern.
1) The first visual is a list of all the federal “guarantees” currently in place… with amounts listed under “explicit” and “implicit”[5] guarantee categories;
a) There is “good news” here… (if one has a rather twisted sense of humor):
The total liability shown is so mammoth (nearly $26 trillion) that any future financial meltdown will not witness a wholesale “bailout”!!
b) “Why is that?” you ask.
The annual GDP of the U.S. is only in the $17-18 trillion range.
And the existing federal debt is already in that same range.
Therefore, the U.S. could not “afford it”.
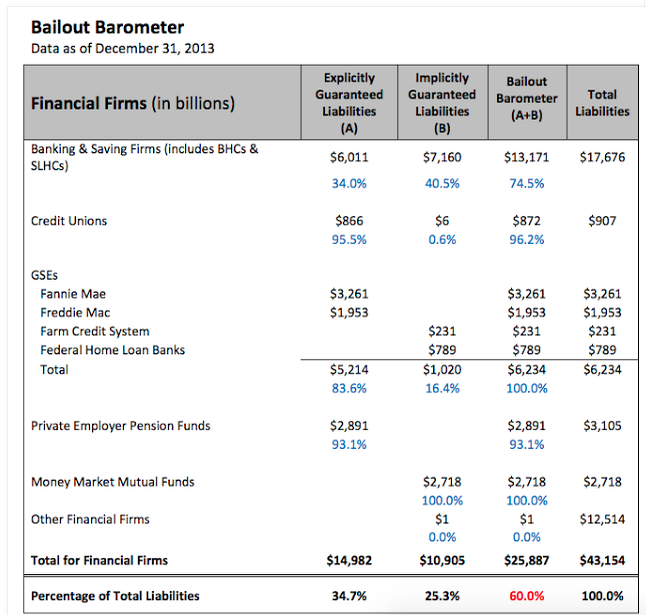
This is a detailed list of "bailout liabilities" presented by the Richmond Fed
2) The second visual is simpler. It illustrates the fact that our federal “bailout” liabilities as of 12 31 13 stand approximately 34% higher now than in 1999!!
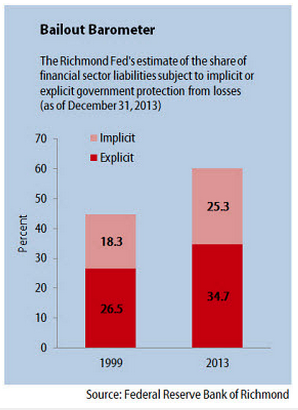
The corresponding graph from the Richmond Fed.
To summarize Lacker’s prime point (and the fundamental reason the Richmond Fed compiles this data):
“When creditors expect to be protected from losses, they will overfund risky activities, making financial crises and bailouts like those that occurred in 2007-08 more likely.”[6]
Before we move on to the “Takeaway”, let me ask if it ever occurs to you that financial news might be “managed”? Could it be that the reason we hear (ad infinitum) about Fed rates and Greece is that it distracts us (rather effectively) from dwelling on more systemic issues such as those posed by Lacker? Sometimes it feels that way.
INVESTOR TAKEAWAY:
I understand that the issues raised by Lacker seem overwhelming and “unsolvable”. Therefore, focusing on them tends to be a “deflating” experience for the average investor.
However, as we decide each year where we will allocate our limited investable assets, it is important for us to have open, transparent access to the “truth” about our financial system. Isn’t it fair for us to expect that some legitimate, authoritative expert should be empowered to inform us, honestly and accurately, whether or not our financial system is stronger, sounder, less “stretched” and more “elastic” than it was 8 years ago?
Yes, I know that is not going to happen – but it should.
In the meantime, we should pay close attention to voices like that of Jeffrey Lacker! Their frank and data-driven perspective can provide vital information we need in order to develop our own risk management strategies!
We also need to pay attention to the risks posed by the mounting evidence that:
1) Equity Volatility is increasing:
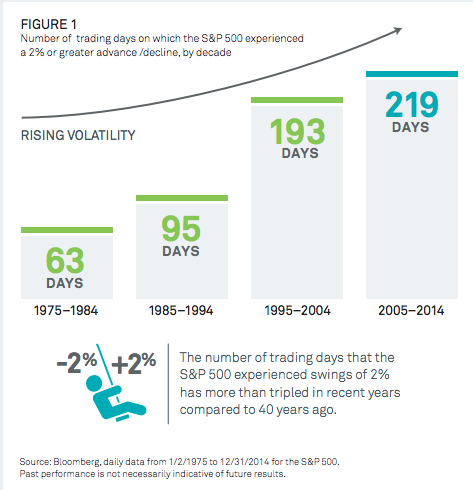
Source BlackRock: https://www.blackrock.com/investing/literature/brochure/ishares-minimum-volatility-etfs-investor-guide-en-us.pdf
2) Bond Volatility is increasing: Just read the personal testimony of major bond traders like Jeffrey Gundlach and Bill Gross during recent months – with domestic and global bonds experiencing a head spinning degree of volatility thus far in 2015.
3) Liquidity has tightened (considerably) in both the bond and stock markets:
see https://www.markettamer.com/blog/bonds-dying-of-thirst .
One of the major reasons why volatility and liquidity have become more challenging is that the unprecedented amount of global Central Bank funds “sloshing” around the world has (in the minds of many observers) made traders more edgy to “get out” when it appears that trouble might be brewing – especially when any given market becomes overextended. You could say that untold traders have their “finger” figuratively poised over the “Sell” tab on their trading platform so they can beat “the crowd” out of this or that investment. That in and of itself leaves the average trader (you and I) at a bit of a disadvantage when it comes (as it likely will) to the next swoop downward (whenever that occurs).
Finally, turning specifically to U.S. bank stocks. Yes, an increase in interest rates (whenever that comes) should increase bank profitability! However, the profits will only be able to grow slowly – as old loans mature and new loans are initiated at higher rates.
The rate issue aside, however, until an investor is confident that our financial system is sounder than it was 8 years ago, one should remain focused on the “basics” of investing:
Risk Management
Diversification
No matter how attractive bank stocks might appear from the perspective of potential outperformance, an investor needs to hold herself to a percentage limit on how big a share of investable assets gets allocated to banks!
In addition, as we have heard Mr. Lacker suggest, there is some “extra risk” that comes with the bigger banks. So consideration might be given to the SPDR® S&P® Regional Banking ETF (KBR) – composed of smaller banks across the country.
Finally, perhaps you grasped earlier the significant (relative) outperformance of JPM during the past several years (and recently). Putting aside the question of corporate ethics entirely, such outperformance might suggest to risk adverse investors that allocating assets into XLF or KBR … or (if preferred) a different money center bank might be a more prudent choice!
Good luck!
DISCLOSURE:
The author does not currently own JPM, XLF, or KBR. He does own positions in SPY. Nothing in this article is intended as a recommendation to buy or sell anything. Always consult with your financial advisor regarding changes in your portfolio – either subtractions or additions.
FOOTNOTE:
[1] Or Rhonda Van Winkle, if you prefer
[2] Just imagine how much mail you’d have to get through!! Holy moly!
[3] I have researched this area extensively. It is amazing how hard it is to unearth specific information on corporate criminal fines/penalties. Even the various “lists” I found identifying JPM’s fines were significantly different – corroborating how arduous compiling an accurate list is. Plus, I’ve discovered that what appears to be a “huge” fine when initially announced by a State’s Attorney of Justice Department official often becomes less onerous when one examines the “fine print”. Funny how that works.
By means of comparison, I was unable to uncover any other bank that has incurred penalties as large as JPM … and the only other corporate penalties that I can find that are comparable in scale to that of JPM are the BP oil spill and the multi-company fines against tobacco companies. Let’s just agree that JPM’s record since 2011 has placed it in very rare (legal) company!!
[4] (a Lacker quote from his speech at the Louisiana State University Graduate School of Banking.
[5] If you enjoyed tortured federal logic… research the detail regarding the why of the various “implicit” guarantees. To oversimplify, they come down to: “We’ve done it before… a precedent has been set… it will be expected.”
[6] A quote from the bank report.
Related Posts
 Why O'Reilly Automotive Stock Sank Today
Also on Market Tamer…

Follow Us on Facebook