As we all know, March 2nd witnessed a new recent high in U.S. equity markets … but then prices started tailing off, climaxing on March 6th with an over 1.5% decline in the Dow Jones Industrials Index, a decline of over 1.4% in the S&P 500 Index, and a tumble of over 1.1% in the NASDAQ. In fact, the S&P 500 Index cascaded downward by almost 30 points, cutting through support at 2100 and even slipping under the December 29th high (2093.55).
Of course, all that downward volatility was precipitated by the report (on the 6th before the U.S. Market opened) of a much higher “new jobs” number than experts had led us to expect! All of a sudden Wall Street seemed stricken with panic that the Fed would accelerate the time table for an increase in interest rates.
Therefore, it is no surprise that the financial press rolled out stories headlined by terms such as: “Over Valued”, “Double Top”, “Fed Fears”, “Beware Equities”, etc. In fact, one author pointed out (with a “tone” that I imagined he intended to be foreboding): “The Dow Jones Industrial Average is now 2.4% below its all time closing high of 18,288…” (set on March 2nd).
Such headlines grab eyes (or “clicks”)… but don’t necessarily shed a lot of light on market risk. After all, how many times since the Spring of 2009 have we been down 2.4%, 4.9%, 7.8%, even 9.9% and yet watched the market spring back to move higher?!
No one can deny that the only perfect market forecaster would be someone who travelled back to March of 2015 from any time period in the future, fully equipped with a print out of S&P 500 Index closing prices through the date she/he travelled back in time.

Marty McFly famously travelled back and forth through time in BACK TO THE FUTURE. But that was (of course) mere fantasy.
Since we cannot anticipate such a time traveller appearing anytime soon, we are left to our own (imperfect) analytical methodologies as we allocate our assets across any/all available investable asset categories. Each one of us seeks out some sort of “edge” vis-à-vis the Market (and will do so perpetually)!
I have occasionally thought about the advantages inherent in an ETF equity vehicle proactively programmed with an automatic “volatility thermostat” – that is, an ETF invested in U.S. equities that will automatically reduce equity exposure once the equity market starts to tumble as it did in 1987, as well as in 2008. (See chart below)
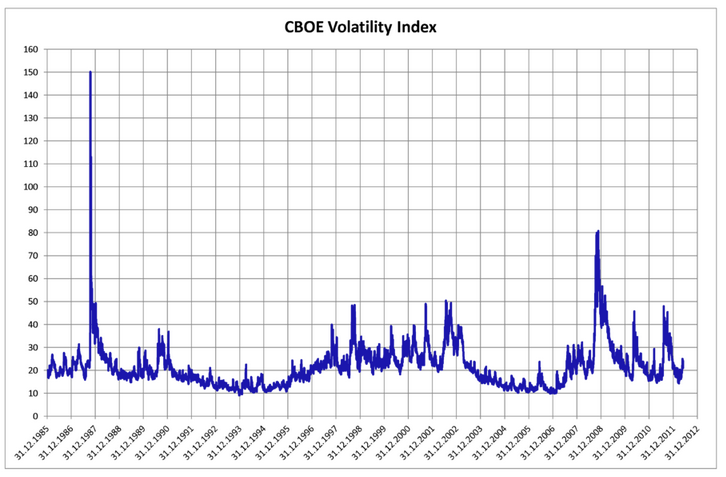
This chart of the CBOE Volatility Index between 1985 and 2012 shows several memorable spikes in the Index!
Does that possibility sound intriguing to you?
If you answered “yes”, there is an existing ETF that attempts to do just that:
Direxion S&P 500 Volatility Response Shares (VSPY)
However, before we dive into details about VSPY, let’s take a look at Volatility in general. Why is the volatility metric important to us today?
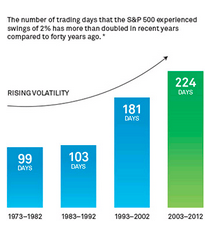
As the graph below illustrates, volatility has been in the rise during the past 42 years: “The number of trading days that the S&P 500 experienced swings of 2% has more than doubled in recent years, compared to forty years ago.”
In January, we examined some “Low Volatility” ETFs (https://www.markettamer.com/blog/a-virtual-neck-brace-for-volatility) and discovered that during recent time periods, PowerShares S&P 500 Low Volatility Portfolio (SPLV) demonstrated better risk-adjusted returns (per the “Sharpe Ratio”) than the standard (straight) S&P 500 Index ETF (ie. SPDR S&P 500 ETF TRUST (SPY)). We also looked at a separate “Low-Vol” ETF: iShares MSCI USA Minimum Volatility ETF (USMV).
Those ETFs maintain a lower volatility than the S&P 500 on a day-by-day basis. In contrast (as we will see) VSPY carries the equivalent volatility (ie. beta exposure) of the S&P 500 Index under “normal” lower volatility conditions, but automatically reduces equity exposure and moves into U.S. Treasury Bills whenever volatility becomes elevated. VSPY’s programmed sensitivity to significant changes in volatility is a virtual “thermostat” that may make VSPY an investment option worth consideration in the current market environment.
What dynamics (if any) about the current market environment could present a “cause for concern”? If one is a disciple of virtually any form of “Valuation Analysis”, a rigorous review of market valuation in 2015 will (at a minimum) lead one toward a “balanced” view of the equity market – in other words, will discourage you from being an outright, flaming, unreserved “Bull”!!
My first case in point is the detailed analysis by Mr. Baijnath Ramraika

of Multi-Act that was published in late December of 2014.[1]

His paper is a virtual workshop on valuation analysis – which is generally divided into two basic categories of methodology:
1) Those built upon asset-based valuation (ABV) tools and
2) Those predicated based upon cash-flow-based valuation (CFV) tools.
Ramraika then laid out various valuation analyses based on:
1) Cyclically Adjusted Price to Earnings (CAPE) Ratio (associated with Yale scholar, Robert Shiller,

Robert Shiller
who shared the 2013 Nobel Prize in Economics).
2) Tobin ‘s Q-ratio (based on the work of the deceased James Tobin,

Dr. James Tobin
1981 winner of the Noble Prize).
4) Market Capitalization-to-GNP (often referred to as one of Warren Buffett’s favored valuation indicators).
5) Trailing Price-to-Earnings Ratio
The author then wrapped things up by indicating that (logically) Multi-Act prefers a blend of multiple valuation disciplines. That being said, Ramraika observes that, based upon his analysis of the first four of the above methodologies (excluding Trailing P/E Ratios), “equity markets currently are more expensive than they were at their peak in 2007.”
In my opinion, the most valuable (but also self-evident) insight offered by Ramraika to less experienced investors is the fact that any and all valuation methods that incorporate the “risk free interest rate” in its calculation must be adjusted to account for the unprecedented (and unproven) global central bank intervention through extreme “monetary easing”. The adjustment used by Ramraika is to replace “market rate” (ie. the current U.S. Treasury security interest rate) with the “natural rate of interest” in valuation calculations. The reason for this adjustment is simple and obvious — under existing circumstances, the U.S. Federal Reserve, the Bank of Japan, the European Central Bank, etc. have seriously distorted market rates – exposing investors to a quite unnatural and unpredictable market future.
As Ramraika points out: “Consider what can happen if you were to make an investment using discount rates based on artificially low (market) interest rates and markets were to close the next day and reopen only after interest rates reverted to their natural levels.”[2] [The investor would lose a good deal of money due to the revaluation of equities prompted by (necessitated by) higher market “risk-free rates”.]
In January of this year, Mark Hulbert offered a quite similar analysis, based upon this graph:[3]
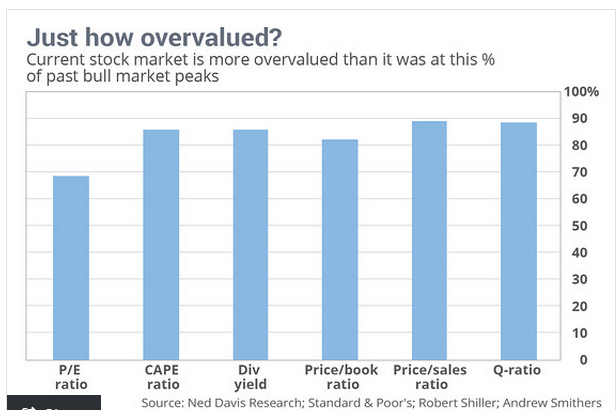
Hulbert correctly points out that market enthusiasts can dissect and critique any one or more of the above “valuation analysis” methodologies – thereby questioning the validity of each particular analytical result. However, given the long history of valuation analysis overall… and the fact that markets have (in the past, at least) invariably “reverted” to the norm of equity valuation calculations… it would be illogical (and risky) to attempt to discredit all of the above valuation methodologies as somehow “irrelevant”!!
With that being said, Hulbert observes that, based on the aggregate calculations of all six valuation methods shown on the graph, the U.S. equity market is more overvalued today than it has been between 69% and 89% of the past century’s bull-market tops.[4]
Let me hasten to emphasize… with bold font… that the mere preponderance of analytical evidence pointing toward current “market over-valuation” does not, by any means, suggest the market is doomed any time soon to a steep decline. As we have reminded our readers upon numerous occasions… markets can become more over-valued… and/or simply remain over-valued… for extended periods of time!! Only a visitor from the future can tell us with certainty the precise day and hour when equity valuations will begin to finally regress to more normal valuation levels.
But, to borrow a phrase all too frequently used by national politicians… let me be clear on this point[5]:
Unless central banks have transformed the timeless (immutable) laws of economics[6], eventually (someday) the U.S. equity markets will revert to more normal levels of valuation!
That being said, the co-head of asset allocation at investment asset manager GMO (Ben Inker) has offered this colorful, creative analogy of our current market condition (likening the market to a leaf in a hurricane): “You have no idea where the leaf will be a minute or an hour from now. But, eventually, gravity will win out, and it will land on the ground.”
Allow me to offer three more well-reasoned insights regarding the market from respect Wall Street authorities:
1) Analyst/Manager Dr. John Hussman has created a framework for projecting market returns based on 10-year expected and realized returns. At the moment, Husmann estimates that nominal returns from the S&P 500 will average less than 1.4% during the next ten years.
2) If it affords you any comfort, Multi-Act projects that the next ten years will generate (on average) 2.0% in nominal returns.
3) And interestingly, asset manager behemoth, the Vanguard Group, recently published (in their quarterly fund reports for the period ended December 2014): “Our outlook on global stocks and bonds is the most guarded since 2006…. Our simulations indicate that the average annualized returns of a 60% equity/40% bond portfolio for the decade ending 2024 are most likely to be centered in the 3% to 5% range after inflation, below the actual average after-inflation return of 5.6% for the same portfolio since 1926.”
By sharing all of the above, I have by no means intended to alarm you. My intention is merely to present reality as objectively as I can, knowing that we all face the market’s future with an uncertainty clouded by this unprecedented rushing flow of monetary liquidity both here and around the world.

Central Bankers around the globe have turned the MONETARY SPIGOT to "wide open"!
That “flow” was initiated by Benjamin Bernanke and adopted by other central bankers. Since we have never before traded in a world quite like this – we all must wonder just when the monetary spigot will run out of “supply” (ie. added monetary stimulus).

For those who want to be invested in equities, but are drawn to an ETF that offers a logical form of volatility “thermostat” which can lower equity exposure at times of greater risk, VSPY is worth looking at.
The folks at Direxion Investments describe VSPY in these terms:
“The strategy follows a quantitative rules-based equity index that seeks to mitigate risk by dynamically changing total equity exposure based on volatility signals.”
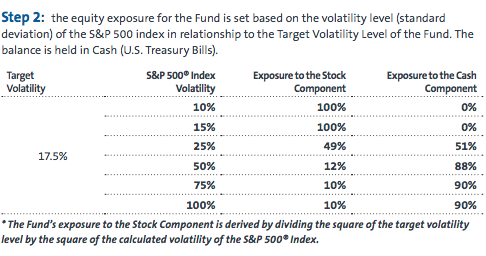
More specifically, as long as the S&P 500 Index Volatility level is below 15%, the underlying index will maintain 100% exposure to stocks in the S&P 500.
However, if/when that Volatility level reaches 25% or above, the underlying index starts a graduated shifting from equities into U.S. Treasury Bills (ie. “cash”). [7]
Here is a slide that offers more detail regarding the ETF’s allocation to equities versus cash at various levels of Volatility:
For those who are “visual learners”, here is a helpful graph:

Quite frankly, no one can objectively say that this design is optimum.[8] However, I tip my hat to the folks at Direxion for being creative in their attempt to design a “self-adjusting” investment vehicle designed for a very uncertain future.
Other details regarding the ETF are fairly straight-forward:
1) Under normal conditions, portfolio components look very much like the S&P 500 Index.
2) The ETF rebalances on a monthly basis.
Let’s take a quick look at its past performance vis-à-vis the S&P 500 Index, as well as the two largest existing “Low Volatility” ETFs we wrote about in January (PowerShares S&P 500 Low Volatility Portfolio (SPLV) and iShares MSCI USA Minimum Volatility ETF (USMV). Note that the S&P 500 Index is painted by “candles” (aqua blue) while SPLV is a red line, USMV is a light green line and VSPY is the black line.
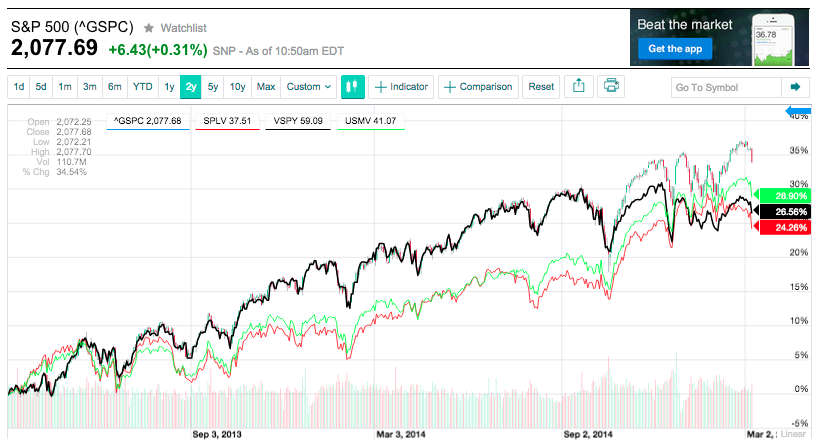
We see that during the course of the past two years, VSPY kept pace with the S&P 500 Index, and outperformed USMV and SPLV… until (that is) the onset of outsized volatility in October of 2014 – resulting in an overall 2 year return of just over 26%, outpacing SPLV, but falling behind the return provided via USMV and the Index!
I am in no way a “shill” for VSPY, but I think I should put its underperformance since October in some context. Remember if you will the very unusual 6% plunge (if you consider the “low” of the decline to be the bottom of the long wick on the 15th) of the S&P 500 between October 9th and October 15th… followed by the explosive recovery into and beyond October 21st! I was struck by how many market veterans were astounded by the slope and speed of the plunge and recovery… a virtual “V”. No one can adequately design an ETF for a move as unexpected and quickly reversed as that “V” move in October … so VSPY was “thrown off its game”.[9]
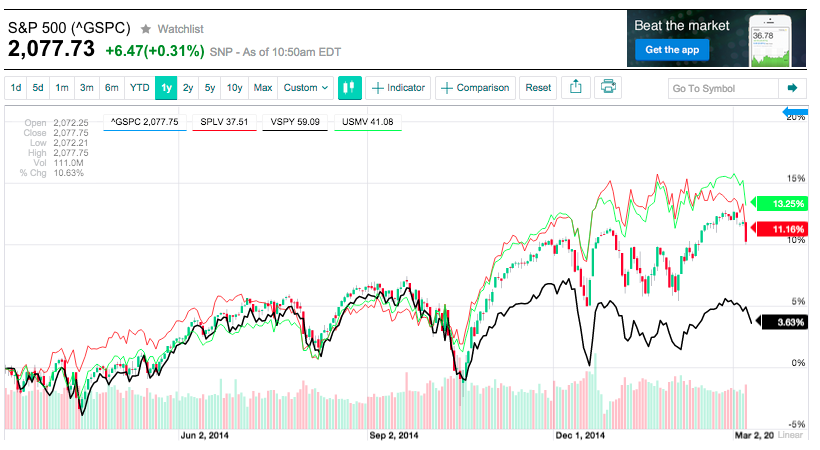
Over the past 1-Year period, the impact on VSPY from this past October is even more obvious, resulting in an underperforming return for the period of 3.6% — versus a range between 11% and 13% for the Index and our two “Low-Vol” ETFs.
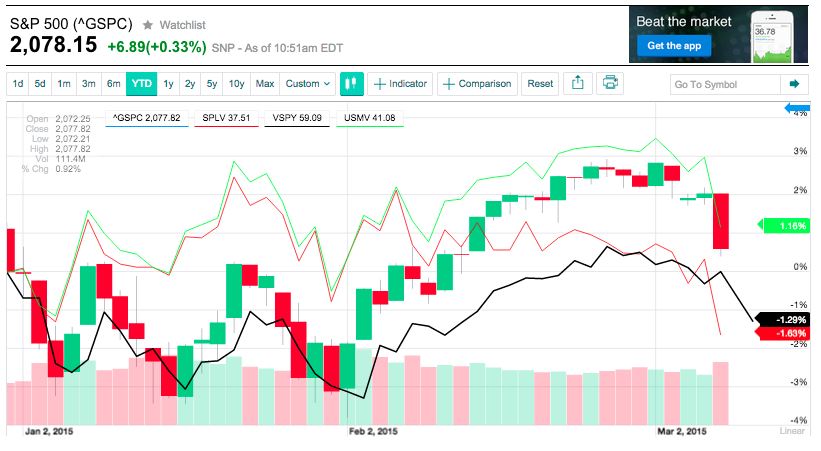 On a Year-to-Date basis, none of these vehicles has shown great performance. And the market tumble following the Jobs Report on March 6th certainly ensured weak YTD returns through 3/6/15! VSPY and SPLV are just over 1% down… while the S&P and USMV are up about 1%.

With the caveat that a 5-Day period has limited validity with regard to this type of analysis, we should note that as the market tumbled on the 6th, VSPY showed a slightly gentler downward slope (as one would expect).
INVESTOR TAKEAWAY:
I think you will agree with me that the “jury is still out” on precisely what an investor can expect from VSPY. During the 1.5 years that led up to October 2014, VSPY was providing excellent “beta” exposure to the S&P 500 Index, while holding the promise of risk management if/when the Index started to falter enough to ignite volatility. But as we saw above, VSPY wasn’t designed to adjust to a “hit and run” price collapse … followed by a “V-shaped” recovery. I don’t think it is quite fair to hold the design team of VSPY responsible for not anticipating a nearly unprecedented steep tumble and recovery in the course of just days.
However, that is (after all) the crux of our current dilemma. We don’t know what we should expect. In fact, the future is quite uncertain. Here is a graph (from iVolatility.com) of the CBOE Volatility Index ($VIX) through 3/6/15. Note that some market observers are indicating that the market might be spooked enough by interest rate fears that the $VIX will trend higher until Janet Yellen reveals the Fed’s intentions on March 18th… possibly targeting the 20-22.5 level.
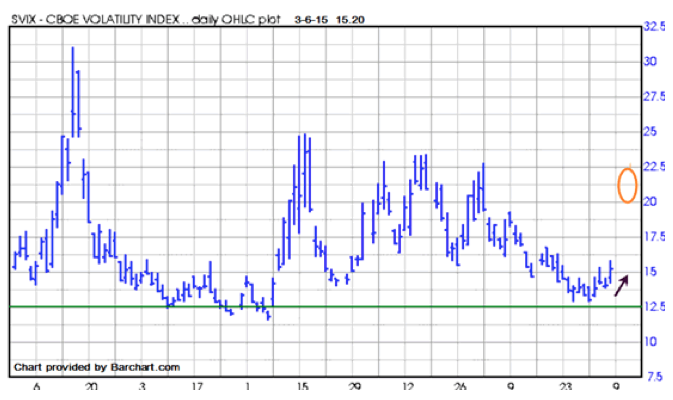
Volatility graph from iVolatility.com
Rational market veterans know that a correction is overdue, and the longer it takes to occur, the more likely it will be that such a correction could be steep. However, with money flowing into the global markets like a flood from the Hoover Dam,

the natural inclination of money (like water) to move until it seeks a “home” (at which it can come to rest) is quite likely to continue to result in global dollars “coming to rest” in the U.S. because:
1) The U.S. Dollar is strong;
2) No market on earth is as liquid and accessible as the U.S. market – on both the equity and fixed income sides of investment choices!
So the eventual equity “regression to the mean” might be delayed for some time due to “money floods”. But no one can be certain.
Someday, however, it will prove beneficial to have prepared in advance for a significant decline. With that in mind, one could theorize that any “normal” future correction will be one within which VSPY is likely to perform as it was intended to perform – as a tool for Risk Mitigation!!
Finally, we must all keep in mind that, by their nature, investment vehicles such as VSPY, SPLV, and USMV are not designed to match or mimic the S&P 500 Index. No instrument will be as effective at that as ETFs such as SPDR S&P 500 Index ETF (SPY), Vanguard S&P 500 Index ETF (VOO), or iShares Core S&P ETF (IVV).
Instead, the focus and intent of VSPY, SPLV, and USMV is to offer us “beta exposure” to equities within the S&P 500 Index within a design that employs a specific element of risk reduction – with the result that these ETFs offer a higher return than the S&P 500 Indexrelative to the risk they bear. In other words, on a risk-adjusted basis, those three ETFs are intended to offer an investor more appealing performance – performance similar to equities, but allowing one to sleep at least slightly more comfortably at night because risk has been ascertainably lowered within one’s portfolio!
DISCLOSURE
The author has exposure to the S&P 500 Index on many levels, including SPY options. The author does not currently own VSPY, SPLV, or USMV. Nothing in this article is intended as a recommendation to buy or sell anything. Always consult with your financial advisor regarding changes in your portfolio – either subtractions or additions.
FOOTNOTES:
[2] That observation sounds obtuse, but is actually proffered on the basis of an old Buffett quote:
“I never attempt to make money on the stock market. I buy on the assumption that they could close the market the next day and not reopen it for five years.”
[3] http://www.marketwatch.com/story/the-stock-market-is-overvalued-any-way-you-look-at-it-2015-01-13
[4] Hulbert offered more detail on each indicator in his article. In his work, Hulbert measured the current bull market move relative to previous bull-market tops since 1900 (using the bull market definition used by Ned Davis Research). Under that rubric, five of the six indicators in the graph today stand more overvalued than they have been between 82% and 89% of prior bull-market tops (since 1900).
[5] OR “let there be no mistake”!
[6] That is, unless Ben Bernanke and Janet Yellen somehow, like Professor Albus Percival Wulfric Brian Dumbledore (of Harry Potter fame)… or Merlin Ambrosius (of the King Arthur legend)… cast an eternal spell on U.S. equity markets.
[7] In the words of the VSPY “Fact Sheet”: “The strategy employs a downside risk mitigation strategy during periods of higher volatility and increases equity exposure when appropriate. The strategy aims to provide an improved risk/return profile relative to traditional beta investing.”
[8] After all, on a prima facie basis, “optimal” is an extremely subjective term. What I might consider “optimal” is likely to be a standard with which countless others would strongly disagree!
[9] I imagine many of us were “thrown off our game” during that same move!
Related Posts
 Why Altcoins Were Getting Mashed on Monday
Also on Market Tamer…


Follow Us on Facebook