One way to manage risk and enhance risk-adjusted investment return is the use non-correlated assets within a portfolio.
- Our most recent articles have highlighted the value of incorporating a “Momentum” strategy within one’s portfolio. Specifically,
1) We demonstrated how helpful the Quantshares U.S. Market Neutral Momentum ETF (MOM) proved to be within an overall portfolio during the period surrounding “Black Monday”:
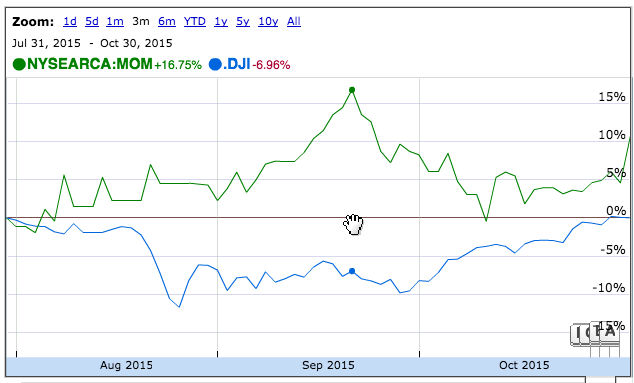
- As this graph demonstrates, between late July and late October of 2015, MOM outperformed the S&P 500. In particular, between July 31 and its peak in the third week of September, MOM registered a 24% return premium over the S&P 500 Index.
[Read more details at: https://www.markettamer.com/blog/mom-performed-well-around-black-monday-despite-the-sec .]
2) In our most recent article, we explained how, despite the “Efficient Market Theory” popularized decades ago, it is a demonstrable fact that a knowledgeable manager can use Relative Strength (and various other trading tools) to guide a portfolio toward significance outperformance. For example, during the most recent two-year period ended October 7th, two “Momentum” ETFs outperformed the S&P 500:
iShares MSCI USA Momentum Factor ETF (MTUM) PowerShares DWA Momentum Portfolio (PDP)
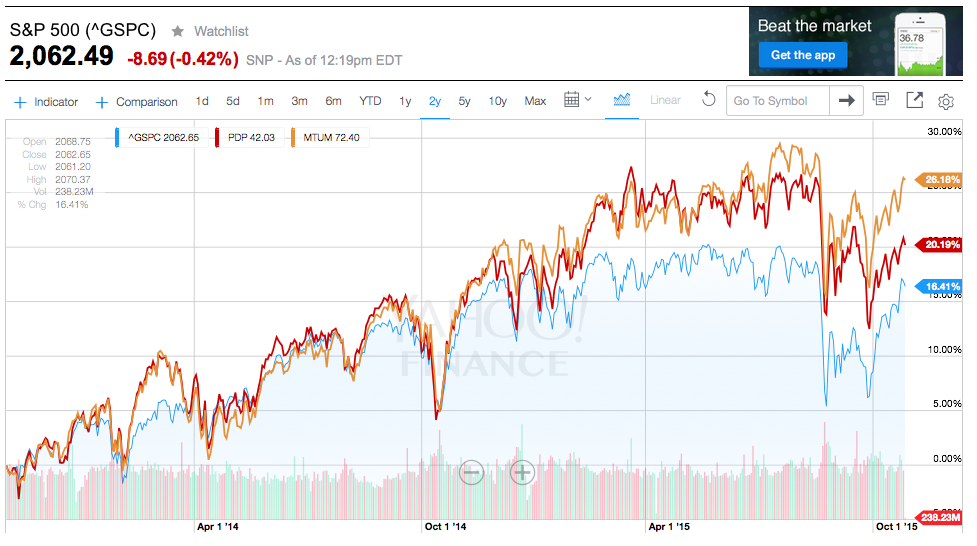
- MTUM produced a return of 26.18% and PDP generated a return of 20.19%, while the S&P 500 Index offered just 16.39%.
[Read more detail at: https://www.markettamer.com/blog/momo-a-momentum-etf-can-help-your-mojo ]
One of the more intriguing points that I learned during my in-depth exploration of “Momentum” was the following:
Although the traditional (and most common) categories of “Style” within portfolio management have been “Growth” versus “Value” … a number of investment analysts and researchers have discovered that a blend of “Momentum” and “Value” strategies can result in a synergistic boost to a portfolio’s positive “Reward/Risk Profile”![1]
Let me take some time at this point to offer helpful background information with which we can then circle back to explore a blend of “Momentum” with “Value”.
Everybody knows that the average investor wants to “beat the market”! (Duh!). However, human nature being what it is, millions of traders/investors are not content with “beating” the market “just a little”[2]! Instead, they feel an impulse to reach for big profits – big profits to be realized “sooner than later”.
In doing so, they unwittingly follow the spirit of a quote from Dame Mary Quant[3]: 
“Risk it; go for it. Life always gives you another chance, another go at it. It's very important to take enormous risks.”
If you ever attend trading webinars, you’ll recognize the type of investor to whom I am referring here – the ones who get impatient to get to the part where the expert offers a “trade idea”[4].
This isn’t entirely surprising – since financial publications, web advertisements, and seemingly perpetual email promotional messages tout the prospect of earning a large return with relatively little effort.
However, those of us who have been investing for decades know all too well that “beating the stock market” is much easier said than done. In fact, a common theme I have heard among (candid) investment professionals this year is how much more challenging this market environment has been from them than any in recent memory!
I wish I had the insight, discipline, patience, and track record of Warren Buffett! The “Oracle of Omaha” is revered and respected around the world precisely because he has empirically demonstrated over many decades that he is an extraordinary money manager! Yes, I know that his “Value Strategy” is currently out of vogue, and (as he will admit) he is not omniscient. That explains a few of his more notable current holdings with weak performance:
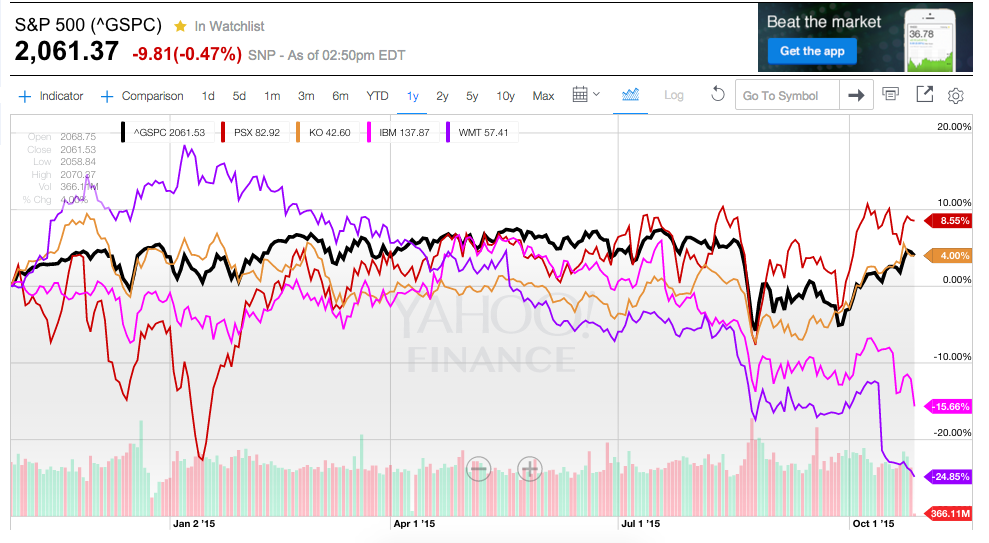
- During the past year, the S&P 500 Index returned 4.02% while IBM (IBM) has fallen almost 16% and Walmart has tanked by nearly 25%!
Keeping in mind that the S&P 500 Index returned 4.02% during the past year, Mr. Buffett’s sixth largest holding (IBM (IBM)) is down almost 16% and his ninth top holding (Walmart (WMT)) has tumbled almost 25%. That being said, two other top Buffett holdings that my initial reaction would have also characterized as “weak” (Philiips 66 (PSX), his sixth top stock; and Coca Cola (KO), his third top holding) have comported themselves quite well – returning 8.6% and 4.0% over this period.
I am confident that “Value” will re-emerge at some point in the months ahead as a great strategic choice — for the simple reason that history has documented the long-term strength of “Value”.
Advisor Perspectives has a penchant for providing excellent, data-driven investment information. ![]() A case in point appears below – a chart showing the outperformance of “Value” over “Growth” (when measured on a trailing five-year compounded return basis):
A case in point appears below – a chart showing the outperformance of “Value” over “Growth” (when measured on a trailing five-year compounded return basis):
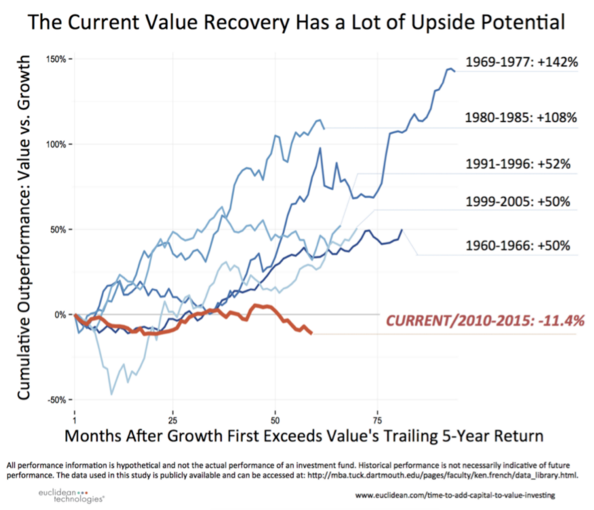
- Over trailing five-year periods, “Value” has outperformed “Growth” during all of the periods shown in blue. The point of this graph is to suggest that the current underperformance of “Value” will almost surely reverse at some point in the near future.
As you can see, the past five years have been challenging for “Value”. But as all Chicago Cubs fans have been recently reassured, “Wait until next year” holds a great deal of promise as we move into the future! Just imagine what Mr. Buffett’s performance could be during the next several years, given the historical trends visualized above![5]
Unfortunately, Buffett’s investing style is not well suited for folks who are impatient. So many of us are not content unless or until we can watch our investments “move”. And such folks particularly appreciate Isaac Newton’s “First Law of Motion”:
“An object in motion tends to remain in motion, and an object at rest tends to remain at rest.”
If you are thinking: “What on earth does Isaac Newton have to do with investing?”… I suggest that you take a deep breath and reflect upon the following true story, which suggests that Mr. Newton may have been a prototype for today’s “I want action” trader:

- History shows that the young genius, Isaac Newton, has much in common with today's average investor!
Back in 1720, Newton invested in the “South Sea Company”. That stock became exceptionally popular and widely followed… leading to the development of extraordinary relative strength and a rapid rise in price. Newton sold his shares once he realized 100% profit on his original investment. That sounds outstanding, doesn’t it?
Unfortunately, human nature being what it was (and still is) investors continued to bid the stock price higher, therefore overpaying for a “growth stock”[6].
As Mr. Newton watched the stock price move inexorably higher, emotion got the better of him and he jumped back into the shares… just before the stock reached its top and began to reverse course! And of course, just as with investors today, poor Mr. Newton kept holding on in the expectation that this “great” stock would once again reverse direction and move back up to where he made his second purchase.
What was the result? I am sure you can guess. He not only lost all of his original profit, but a bunch more, too boot! In an attempt to cope with that costly disappointment, Newton turned philosopher:
“I can calculate the motion of heavenly bodies, but not the madness of people.”
Contrasting Mr. Newton’s experience with the investing approach of Mr. Buffett, I think we will all agree that:
Volatility to the downside is much more destructive of investing profits[7] than upside volatility will ever prove to be beneficial to said profits. Therefore, we should always be aware that trading higher beta stocks exposes us to the potential risk of swifter downside moves (eliminating profits and destroying wealth).
So far, what we have established is that “beating the market” is quite challenging. And we have established that, despite the inexorably tempting siren call of trading for “big profits” or “quick profits”, we are much better served if we invest and trade with the mindset of a “realist” and risk manager!
In that vein, keep in mind the following statistics[8] from 2014 (as of 12/31/14) regarding the investment return achieved by the average equity mutual fund investor, as well as the average mutual fund fixed income investor.
|
RELATIVE RETURN |
2014 Calendar Year |
20 Year Ave (12/31/14) |
| Average Equity Investor |
5.50% |
5.19% |
| S&P 500 Index | 13.69% |
9.85% |
|
RELATIVE RETURN |
2014 Calendar Year |
20 Year Ave (12/31/14) |
| Average Fixed Inc. Investor |
1.16% |
0.80% |
| Barclays Aggregate Bond Index | 5.97% |
6.20% |
Given all of the above, what can an investor do to create a portfolio with positive return potential that also side steps the worst consequences of volatility experienced by Isaac Newton, as well as millions of “average investors” in this 21st Century?
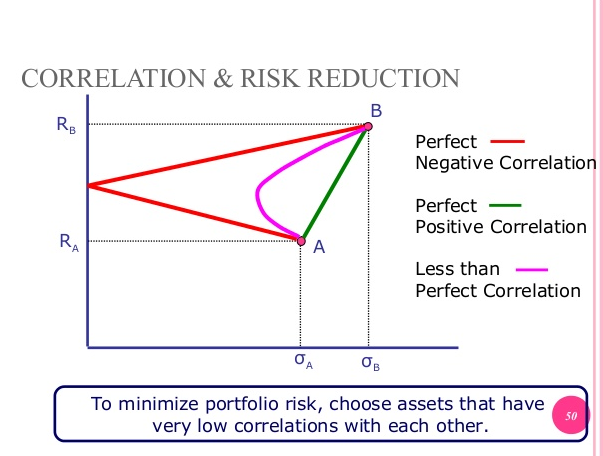
The answer (I would suggest to you) is rooted in our old friend – “the Efficient Frontier”. Most of our readers are quite familiar with this concept. However, if you are not familiar with it, or you could use a quick review, here is a link to a brief streaming video (and narrative) that offers a cogent explanation regarding the “Efficient Frontier” (note that the video link is two-thirds of the way down from the top of the screen):
http://www.investopedia.com/terms/e/efficientfrontier.asp
Don’t hesitate for a moment to access that link. This concept is quite counter-intuitive, and therefore bears periodic review. The reason the concept is so helpful is that it unlocks one key toward the “optimization” of a portfolio on a “Risk/Reward” basis.[9]
In an earlier article, I tried to summarize a theoretical rationale for combining a “Momentum Strategy” with a “Value Strategy” by pretending I was answering a question on the final exam of an MBA-level course entitled “Investment 101”:
“We learn from ‘the Efficient Theory’ (see chart below) that pairing non-correlated (complementary) strategies can generate improved risk-adjusted returns. ‘Value’ strategies are built upon finding stocks with solid fundamental characteristics that are under-appreciated by investors. ‘Momentum’ strategies are based upon measures of ‘Relative Strength’ (which often ignore fundamental details).
“Data demonstrates that over a short to intermediate time period, strategies focused on momentum can shine… while (in contrast) over longer stretches of time, strategies centered upon fundamentals will outperform the market as a whole. Therefore, combining these two strategies serves to ‘smooth out’ the aggregate monthly and quarterly returns of the portfolio, as well as enhance measures of risk-adjusted return!”
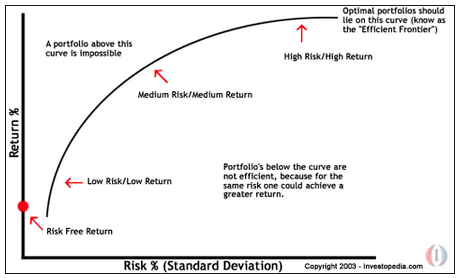
- As the “Efficient Frontier” graph illustrates, combining strategies and/or asset classes is an effective way to enhance risk-adjusted returns!
Moving from the theoretical into the “real world” of portfolio management, Dr. Clifford Asness of AQR Capital Management is a recognized authority on the virtues of combining “Momentum” and “Value” (not least of all because AQRactually runs active portfolios utilizing the principles developed by Asness and his colleagues):

- Dr. Clifford Asness of AQR Capital Management
“… literature finds that, on average, value stocks outperform growth stocks and stocks with high positive momentum outperform stocks with low positive momentum.” — Clifford Asness, AQR Capital Management
The most obvious explanation for the impressive data that demonstrates superior “Risk/Reward” characteristics from a portfolio that blends “Momentum” and “Value” is that these strategies are negatively correlated.[10] And as was confirmed by your review of the “Efficient Frontier” – pairing negatively correlated assets tends to smooth out one’s investment return curve and result in fewer sleepless nights – as well as in less frequent emotional urges to sell stocks and move into bonds or cash[11]
Asness quite helpfully provides us an empirical metric that quantifies this negative correlation: negative 0.65. When you consider that negative correlation can go no lower than negative 1.0 – the negative correlation of “Momentum” and “Value” is quite impressive!
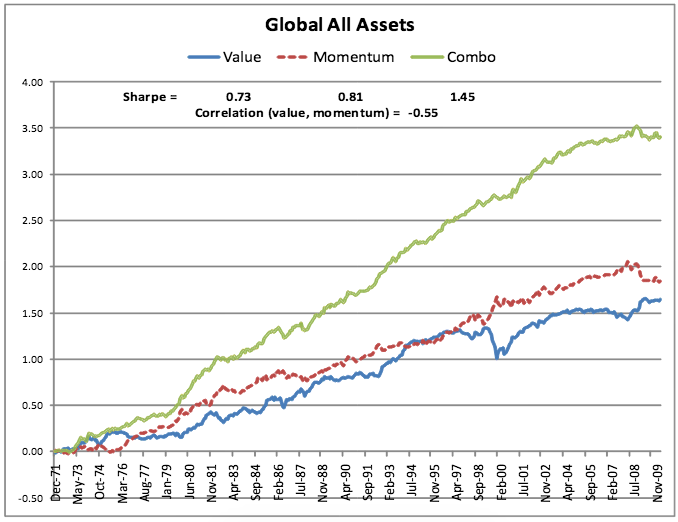
Asness’ various research studies on this topic have also generated one of those “counter intuitive” results to which I referred earlier. Consider this, from the results that appeared within his 2012 paper (“Value and Momentum Everywhere”) :
1) A “Value” portfolio (low price to book value) that is re-balanced annually outperforms the overall stock market;
2) A “Momentum” portfolio (12-month price appreciation) that is re-balanced monthly[12] also outperforms the market as a whole;
3) However, far more superior is the return gleaned from a 50%/50% combination of a “pure Value” sub portfolio and a “pure Momentum sun portfolio!!
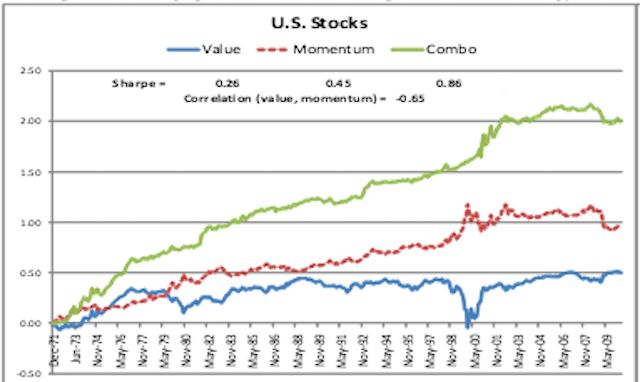
- This graph comes from Dr. Asness' study of Momentum and Value Strategies.
Note that the combined strategy portfolio generated twice the return of either portfolio separately! Also note that the “Sharpe Ratio” for “Value” was 0.26… for “Momentum” was .45… and for the combined portfolio, 0.86 (confirming outperformance both nominally and on a “Risk/Reward” basis!).
A natural comment at this point would be: “That’s just fine for the U.S. market. But what about other markets around the world?”
Asness has you covered, readers!! In his extensive study, he reviewed the performance of these two strategies across eight different countries (U.K., Europe, Japan, etc.). Asness’s results showed that a “combined” portfolio (such as that described earlier) outperformed everywhere in the world… except Japan, where “Momentum” did not seem to function as it did elsewhere). This is from Asness:
“We find consistent and ubiquitous evidence of value and momentum return premia across all the markets we study. We also highlight that studying value and momentum jointly is more powerful than examining each in isolation. The negative correlation between value and momentum strategies and their high positive expected returns implies that a simple combination of the two is much closer to the efficient frontier than either strategy alone, and exhibits less variation across markets and over time.”
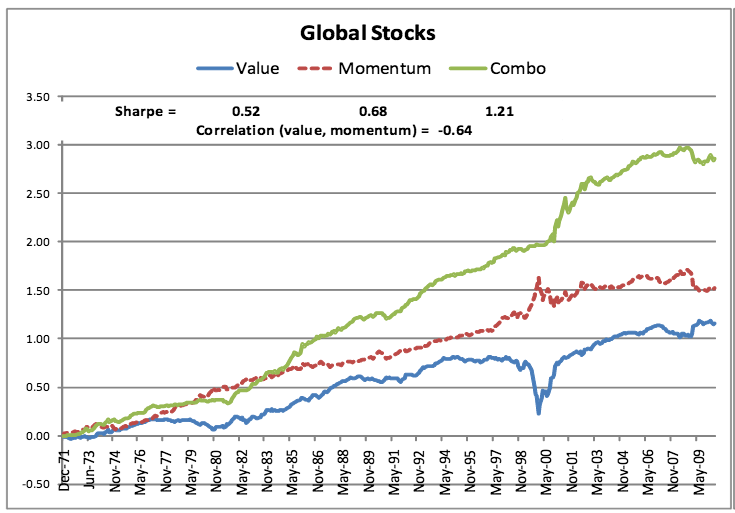
- Another graph from the work of Asness.
- Another Asness graph.
Now let’s complement the expertise and analytical work of Asness with parallel work developed from other sources. A good example is an elaborate and detailed study published this year by Dr. Jack Vogel : [http://blog.alphaarchitect.com/2015/03/26/the-best-way-to-combine-value-and-momentum-investing-strategies/ ]
Dr. Vogel gathered market data from a 50-year period (1963 to 2013). Here is some information that will enable you to interpret the data tables below:[13]
We will form the portfolios at a monthly frequency with the following 2 variables:
1. Momentum = Total return over the past twelve months (ignoring the last month)
2. Value = EBIT/(Total Enterprise Value)
We form the simple Value and Momentum portfolios as follows:
1. EBIT VW = Highest decile of firms ranked on Value (EBIT/TEV). Portfolio is value-weighted.
2. MOM VW = Highest decile of firms ranked on Momentum. Portfolio is value-weighted.
3. Universe VW = Value-weight returns to the universe of firms.
4. SP500 = S&P 500 Total return.

- This comes from Dr. Vogel's study.
Let me try to highlight key points that can be gleaned from this extensive compilation of study data:
- The top decile of Value and Momentum outperformed the index over the past 50 years.
- Momentum had stronger returns than Value, but much higher volatility and drawdowns.
- That being said, Momentum and Value demonstrated similar risk-adjusted parameters.
- Note in particular the “Sharpe Ratio” metrics from the studied portfolios. Keep in mind that a higher “Sharpe Ratio” reflects better risk-adjusted performance:
Value 0.65 Momentum 0.61 S&P 500 0.39
- A portfolio that incorporates an equal percentage of Momentum and Value generated the highest risk-adjusted returns across all portfolios.
As we highlighted earlier, a primary key that accounts for the risk-adjusted superiority of a “Value”/”Momentum” portfolio is the fact that the two strategies demonstrate a very low (to negative) correlation:

- From Dr. Vogel's study.
As you can see, this long-term study shows a correlation factor between “Value” and “Momentum” that is very low — 0.530.
I have a confession to make to my readers. My background work on this article was abysmally inefficient. Why?
Sometimes I suspect that I have an “Alice in Wonderland Complex” because I so frequently find myself drawn to going down “rabbit holes”. My initial research effort headed in the direction of original research comparing “Value” and “Momentum” strategies through the compilation of hard, original data drawn through a free resource offered by a major brokerage house at which I hold several accounts.[14]
However, much to my dismay, after spending several days in that effort, I discovered that the underlying data was (at best) inconsistent, and (at worst) incorrect. My goal was to empirically establish relative performance from 2007 to 2015; but once I made my unfortunate discovery, I had to scrap all of that work and move on.
Next, I accessed a free website at which I have always found graphs and metrics which, at the very least, are helpful in establishing “relative” return and risk/reward characteristics.[15] I examined (in as much detail as I could) these three ETF securities:
Guggenheim S&P 500 Pure Value ETF (RPV)[16]
Powershares DWA Momentum Portfolio (PDP) [see the earlier articles referenced earlier for more details]
SPDR S&P 500 ETF Trust (SPY) [the standard ETF proxy for the S&P 500 Index]
Below is some of the information I uncovered through the previously referenced website:
Between March 2007 and Oct 16 2015, here is the return provided through these ETFs:
PDP 79.3%
RPV 77.5%
SPY 73.3%
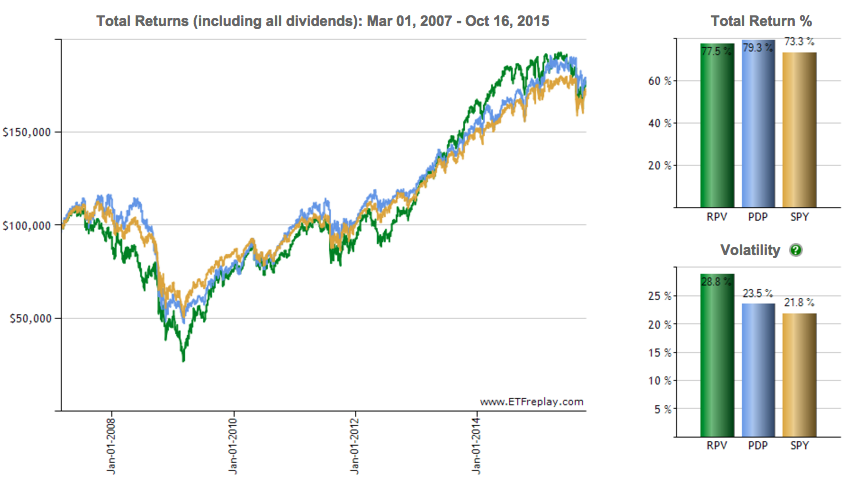
Notice that the volatility metrics shown above are a bit surprising. I would have assumed that “Momentum” would reflect the highest volatility. However, it was “Value” instead:
RPV 28.8% PDP 23.5% SPY 21.8%
During the 6+ year period between the market “low” (March 2009) and October 16, 2015, here are the relative return numbers:
RPV 493.5%
PDP 264.5%
SPY 230.8%
My eyes nearly popped out of their sockets when I saw the outperformance of “Value” during that period!
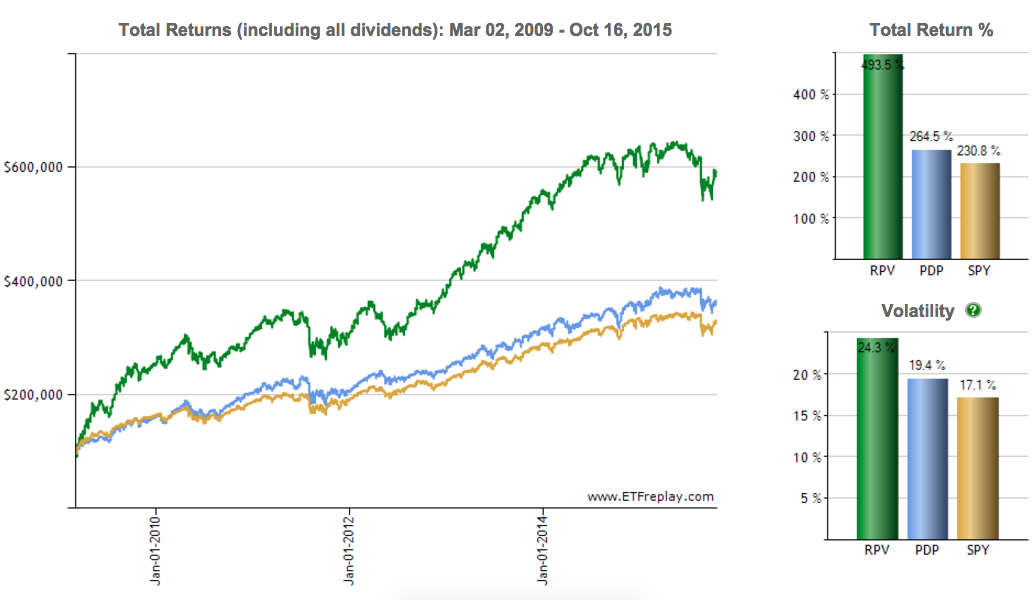
Once again, “Value” reflected the most volatility:
RPV 24.3% PDP 19.4% SPY 17.1%
Between mid-August of 2011 (the U.S. Treasury “default” that resulted from egregious Congressional dysfunction) and October 16th (2015), here are the return metrics:
RPV 103.2%
PDP 78.0%
SPY 83.9%
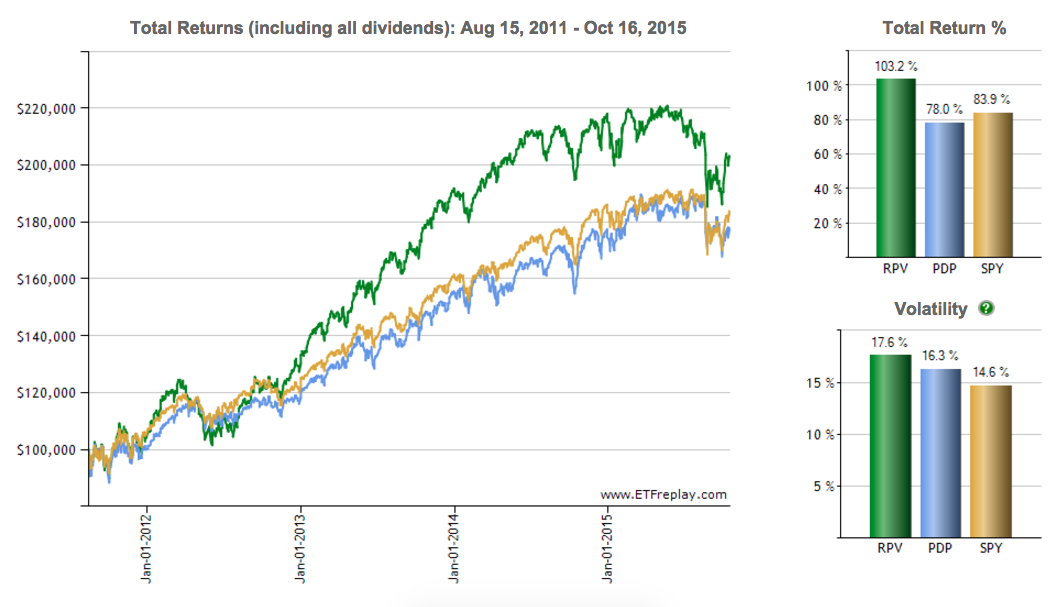
As we have come to expect, “Value” showed the most volatility
RPV 17.6% PDP 16.3% SPY 14.6%
Finally, and this data demonstrates the advantage of negatively correlated strategies, during the past 15.5 months (June 30, 2014 through October 16, 2015), “Value” has underperformed both of the other ETFs:
PDP 7.4%
RPV – 3.8%
SPY 6.5%
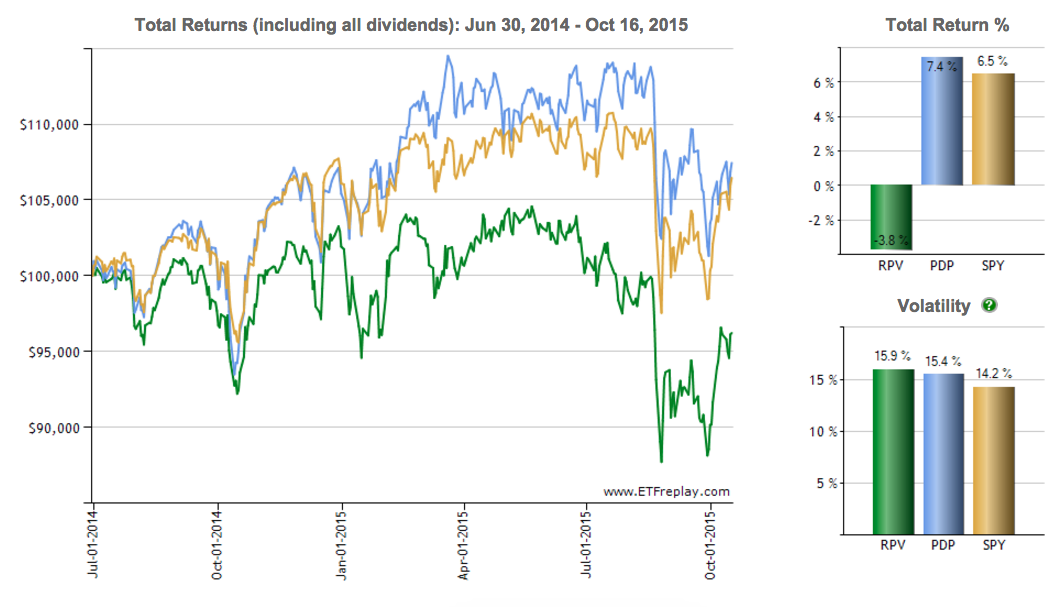
That being said, it is noteworthy that the differential on volatility materially narrowed during this period:
RPV 15.9% PDP 15.4% SPY 14.2%
Can we agree that, thus far, the extensive data from Dr. Vogel (over 50 years) and the visual graphs from ETFReplay.com (above) both offer convincing evidence of at least one conclusion:
A combination of the Momentum and Value Strategies (in equal measures) within a portfolio can (indeed) outperform the S&P 500 Index.
In addition, Dr. Vogel has demonstrated convincingly that the risk-adjusted return of the above referenced combination is superior to the risk-adjusted return of the S&P 500 Index. (The ETF website referenced above does not delve into risk-adjusted return.)
At this point I have another confession for you: although I was not born in Missouri, I do have a dominant “Show Me” attitude with regard to investments[17]. I am old enough to have been “taken in” by a number of articulate investment con artists – individuals gifted in presenting what appears to be a compelling investment “story”, but ultimately turns out to have been a “house of cards”.[18]
So it should not be surprising what I did next:
1) I downloaded price data for SPY, PDP, and RPV between March 1, 2007 (before the onset of the “Financial Crisis”) through October 16th of this year.
2) I went, day by day, through that price data to identify “dividends paid” for each ETF during that entire period.
3) I assumed that I requested the payout of all dividend and capital gain distributions in cash.
4) It is vital to note that I added the “cash paid” distributions to the total value of my investment in each ETF in order to arrive at a “total return” figure for each strategy.
5) I assumed that I purchased $20,000 worth of SPY and $10,000 each of PDP and RPV on March 1, 2007.
As you can imagine, the above work resulted in three huge, hairy worksheets… each one with almost 2200 rows! In order to analyze this data, I therefore had to consolidate it. Here is my (over)-simplified worksheet:
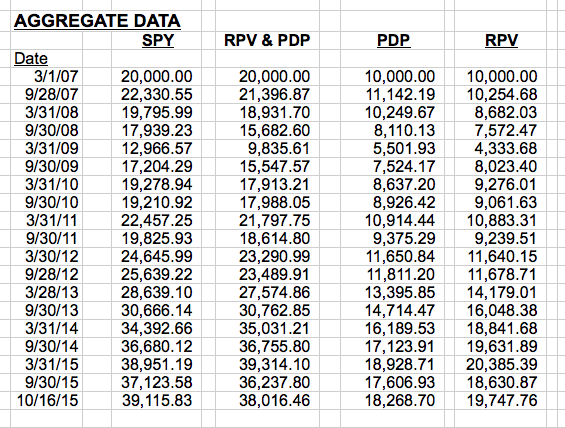
For those interested only in the “Big Picture”, the key columns above are “SPY” and “RPV and PDP”. Based upon the above, the $20,000 investment in SPY ended up with a better total return than investing $10,000 each in RPV and PDP.
Ahhh, but the “Big Picture” only tells part of the story! [Never forget that almost everything in the investing world is more complicated than it might otherwise appear!] For example:
1) Timing of the Initial Investment: if you had commenced your investing on March 31 of 2009 (just after the “Market” reached its nadir), and you had invested the following amounts—
a) $5,502 in PDP and only $4,334 into RPV (total of $9,836) versus fully $12, 967 into SPY … by October of 2015 you would have discovered that the combination of PDP and RPV outperformed SPY (total return basis) by approximately $2,000!!!
2) The Method of Calculating Return:
a) The table below shows the cash distributions paid from each ETF during that period. The paltry dividends paid by PDP should not be surprising (if you think about the typical stocks in which it invests). RPV is much closer to the yield of the SPY, but still falls a bit short.
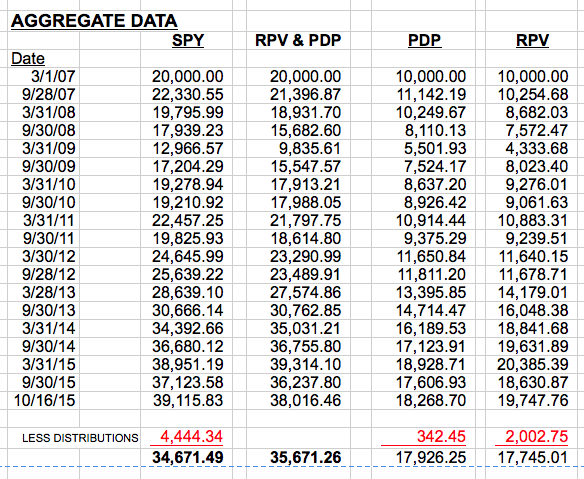
b) If anyone (for reasons I cannot fathom) ignored dividends and capital gains distributions and compared the strategies that I compared and contrasted on the basis of ETF price appreciation alone, the PDP/RPV combination outperformed SPY during the period studied. [As you see above, I subtracted out the distributions from the previously calculated “total value”.
3) Risk-Adjusted Return: Although I do not have the tools and expertise to calculated risk-adjusted returns (using this accumulated data) during this period, my research has made me sufficiently confident enough to stipulate that the Momentum and Value Strategy combination provided a more desirable risk-adjusted return than that of SPY.
4) The “Wax and Waning” of Strategies: Once again, I draw your attention to the data from March 31st of 2009 onward.
We could have started investing in this strategy on that date with just $4,334 into RPV … while investing $5,502 into PDP.
In just six months, our statements would have shown $8,023 in RPV and only $7,524 in PDP!!! Obviously, RPV “jumped way ahead right out of the gate”!!
However, that being said, each of those strategies had strong periods and weaker periods throughout this 8-year period:
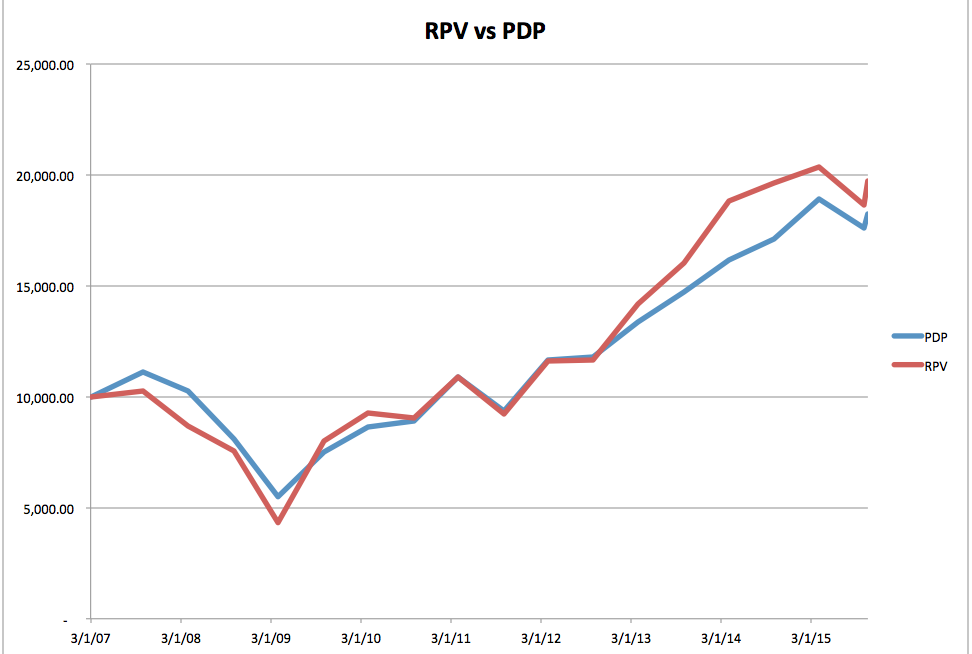
This graph compares the relative magnitude of the price slopes within RPV and PDP. Pay particular attention to the upward slopes between March 2009 and the present.
Therefore, the fact that these strategies are negatively correlated helps to improve the relative performance of the combination within a portfolio!
INVESTOR TAKEAWAY:
This has been a long article. However, l hope you have found it more than worthwhile.
The time it took me to put this research and article together brings to mind a comment made in class by Dr. N. Philbrick (a Brown University professor) some 45 years ago:
“You should take as much time to read a book as the author took to write it.”
Obviously that quote made a huge impression upon me (to have remembered it so clearly nearly half a century later). But I do offer fervent thanks that none of my readers will ever need to consume anywhere near as much time reading this as I did to write it!
Here are the primary points I hope that you carry away from this article:
1) Nearly everything within the investment world is more complicated than, at first glance, it would seem to be.
2) It is essential for you to be perpetually skeptical regarding what you read about investments.
a) Make sure that the author makes crystal clear the assumptions she/he has made in their analysis and conclusions.
i) You have seen above how different one’s conclusions could be in reaction to each of the various approaches I have described regarding the benefits of combining the “Value” and “Momentum” Strategies.
3) There is no “Holy Grail” in investing. If one is invested in equities during any time remotely akin to the 2007-09 period, you will lose money. I guarantee it! And as you saw in my worksheet above, you’ll lose a lot!
a) My worksheet demonstrates that an investor in SPY would have lost 35% between March of 2007 and March of 2009.
b) Someone who invested half their funds in PDP and half in RPV on March 1, 2007 would have lost almost 51% by March of 2009.
c) However, the “Good News” is that by 2015… even those ill-timed investments would have proven rewarding!!
4) I cannot help but note (parenthetically) that the only folks who made money between 2007 and 2009 were those who, like the big bankers and investment houses, shorted the securities they were selling to you and me![19]
5) Whenever a financial investment salesperson presents a “compelling story” to you about this or that investment, I urge you to join me in the “Missouri Spirit”. Be skeptical… ask for detailed documentation regarding any/all underlying studies, reports, analyses, etc.
a) Don’t invest based on a phone conversation alone.
b) Give any investment decision serious and critical thought.
c) Based upon the research I accumulated above, I believe I could convince the average investor of pretty much whatever I wanted to convince her/him!
i) Yes, that sounds horribly cynical… but I am a product of my generation[20]… and I am a realist regarding investments.
ii) To spare me from ever being tempted to put my interest above anyone else’s, I intentionally have never “sold” an investment product to a client.[21]
All of the above being said, I can offer my own conviction that the combination of a “Momentum Strategy” with a “Value Strategy” makes considerable sense as a way to capture an improved “Risk/Reward Profile” and risk-adjusted return!
By way of supplementing all of the above… as well as circling back to the reference to Warren Buffett made near the beginning of this article, let me conclude with this excerpt from an engaging and intriguing article about the “Buffett Strategy” [http://www.cbsnews.com/news/how-warren-buffett-beats-the-market/ ], which confirms the importance of a multi-dimensional portfolio that incorporates “Value” (such as the one suggested in this very article):
“Warren Buffett has long been considered one of the greatest investors of his generation. In fact, Berkshire Hathaway (BRK.A) has a higher Sharpe ratio (a measure of risk-adjusted returns) than any stock or mutual fund with a history of more than 30 years. Even after taking into account the four traditional factors (market, size, value and momentum), Berkshire has a significant alpha, or returns above an appropriate benchmark.”
DISCLOSURE:
The author currently owns positions in SPY and other funds/ETFs indexed to the S&P 500 Index, but has not yet invested in PDP or RPV. Nothing in this article is intended as a recommendation to buy or sell anything. Always consult with your financial advisor regarding changes in your portfolio – either subtractions or additions.
FOOTNOTES
[1] To learn more about Reward/Risk, peruse these:
https://www.markettamer.com/blog/sharpen-your-analysis-of-ibb-xbi-and-fbt ;
https://www.markettamer.com/blog/key-information-ratio-for-deciding-between-fcntx-and-rgaax
[2] Alas, decade upon decade of accumulated data reveals conclusively that the average investor far underperforms the market.
[3] “Quant” – ah, a last name ideal for inclusion in an investment article. Mary Quant may be one of the most socially influential persons you have never heard of! Born in 1934, she is a Welsh fashion designer who proved to become a pivotal force in the popularizing of the “Mini Skirt” (as well as “Hot Pants”). She became a British fashion icon in the 1960’s. I doubt you’ll see here referred to in any other investment article.
[4] For “Educational Purposes Only”, of course.
[5] The chart can be found at: http://www.advisorperspectives.com/articles/2015/08/11/why-you-should-allocate-to-value-over-growth
[6] Often referred to as a “Growth Trap”.
[7] And accumulation of wealth.
[8] This data comes from Dalbar.com. ![]() In the interest of full disclosure, the previously mentioned Advisor Perspective has a long article (http://www.advisorperspectives.com/articles/2014/06/17/a-simple-explanation-for-dalbar-s-misleading-results ) that explains in detail why the Dalbar study is flawed. It has to do with the calculation method(s) used by Dalbar (time-weighted vs. dollar-weighted, etc.). The premise posited in the article for the calculation issues boils down to the time honored American free enterprise motive. It enhances the “product” marketable to financial advisors as “Exhibit 1” regarding why investors need the expertise of an advisor. Since I do not sell financial products to clients – I can be agnostic on this issue.
In the interest of full disclosure, the previously mentioned Advisor Perspective has a long article (http://www.advisorperspectives.com/articles/2014/06/17/a-simple-explanation-for-dalbar-s-misleading-results ) that explains in detail why the Dalbar study is flawed. It has to do with the calculation method(s) used by Dalbar (time-weighted vs. dollar-weighted, etc.). The premise posited in the article for the calculation issues boils down to the time honored American free enterprise motive. It enhances the “product” marketable to financial advisors as “Exhibit 1” regarding why investors need the expertise of an advisor. Since I do not sell financial products to clients – I can be agnostic on this issue.
[9] The primary reason I suggest this concept is “counter intuitive” is that it has been empirically established that adding an appropriate “riskier asset” to a portfolio can actually significantly boost the “Risk/Reward” profile of that portfolio!!
[10] Over long periods of time, when one strategy “zigs”… the other strategy tends to “zag”.
[11] An urge which, more often than not, leads to higher transaction costs, higher taxes owed, and lower returns.
[12] Note that the greater frequency of re-balancing will result in higher transaction costs.
[13] The study results are gross of management fees and transaction costs. All returns are total returns and include the reinvestment of distributions (e.g., dividends). The study period was 7/1/63 through 12/31/2013.
[14] Not being a fan of risking a lawsuit, I will not disclose the name of that provider.
[15] The website is etfreplay.com
[16] I chose RPV only after reviewing all of the leading value strategy ETFs that have sufficient liquidity and AUM to be a viable trading vehicle. I discerned that RPV was the best choice to use as a value complement to my preferred momentum ETF (based on my prior articles)
[17] In case you did not know, Missouri is known as the “Show Me” state.
[18] I deserve a commendation for “Restraint” in characterizing these individuals!
[19] Which is precisely why most of those financial institutions have been required to pay huge fines and penalties to the federal government.
[20] I have developed a convincing analysis regarding why those born between 1945 and 1955 became confused, then skeptical, then anti-authoritarian (we were the protestors of the Vietnam War… the ones beaten during the 1968 Democratic Convention in Chicago, etc.) and eventually cynical. I hasten to add that at least two prominent presidential candidates were born during the 1946-47 period (one Republican and one Democrat) and represent two of the most cynical individuals you could ever hope to find.
[21] I have been a “fee-only” Certified Financial Planner since 1995.
Related Posts
 Why O'Reilly Automotive Stock Sank Today
Also on Market Tamer…


Follow Us on Facebook