From countless articles, blogs, and sales pitches, it can seem like it's all about picking the right stocks.
But experienced traders know that is only the beginning of the process of successful trading. There is also the filtering process, proper trade entry, money management, trade management, trade exit, and post-mortem analysis and learning. Each of these can have, and have had, entire books written on the subject. If successful trading was easy, everyone with access to a broker and a starting balance would be rich.
By the same token, it doesn't have to be complicated. Take ‘filtering' for instance. You've spent the weekend searching for good trade candidates. You've looked at hundreds of charts. You've cross-checked fundamentals. You've checked news, earnings dates, dividends, and new product announcements. You've spent so much time on it, your spouse isn't talking to you and your teenage daughter has met, dated, broken up with, and cried over two boyfriends.
You have though ended up with a list of good quality trade candidates. But therein lies the problem. You can't, and shouldn't, trade all of them. Which one or ones should you actually consider for a trade?
You will of course narrow down the list by considering their prices, whether they have actively-traded options available, if they are due to announce earnings, portfolio diversification considerations, and so forth.
After all that, you might want to think about probability of success. This weekly chart of W. W. Grainger shows you how simple this part can be. It shows a stock that has gained over 400% since the March 2009 low, and has recently climbed to yet new highs. Quite a strong stock. Grainger distributes tools, lighting, plumbing, and other maintenance products. GWW current sports an earnings growth rate of 17%, a Return on Equity of 27%, and a 1.4% dividend – quite respectable.

Is that optimistic rise in the stock price justified? It may be. But then again, just how many HVAC controls and fuses is Grainger likely to sell over the next couple of years. Will their market increase enough to justify a further 100% gain per year? The current estimates are for 15% gains in earnings each of the next two years. That won't justify further gains in the stock similar to recent gains.
But look at the weekly price chart itself (I used a logarithmic scale so equal percentage moves are the same distance no matter what the price). Look at how far GWW ventured above the 50-week moving average each time before pulling back to, or below, the average. Match those highs with the Stochastics indicator.
Now, consider GWW's current price, the distance GWW is above its 50-week moving average, the current Stochastic value, and ask yourself one question:
Is a long trade in GWW, at this point, a high probability trade?
Not really. In fact the odds favor a retraction, a ‘regression', back towards the moving average, the ‘mean'.
Other current examples can be found in Boeing (BA), H & R Block (HRB), Directv (DTV), Home Depot (HD), Valeant Pharmaceuticals (VRX), Walgreens (WAG), and many more.
Does that mean these stocks can't be considered for short-term bull trades? Not at all. There may be short-term bullishly-oriented trades that can be justified in these, and similar, stocks. But remember, you will be sailing into a headwind. You will have less room for error, and less time and options available for appropriate position adjustments, if the stock starts ‘regressing to the mean'.
Now let's say another stock on your buy list is Apple (AAPL). This is a stock that has been beaten down in recent months. But it still is growing revenue by double-digits, year-over-year, still has an earnings growth rate of 62%, a Return On Equity of 43%, 4,430 funds holding it, and it even pays a 2.8% dividend. While their iPhone, and its competition, gets all the media focus, you're starting to notice an increasing number of companies incorporating Apple's iPad into their products and services, and a lot of people are carrying them around all the time. You don't hear mention of this on the news.
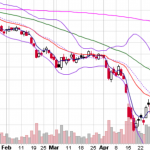
So you go back to AAPL's chart, this time the weekly chart. AAPL is below its 50-week MA, the stock has been building a base, and the weekly Stochastic has just given what is considered a ‘buy' signal.

Now, which stock do you think is the higher probability trade – the distributor of fuses sitting well above their 50-week MA, or the manufacturer of the iPod, iPhone, iPad, an possibly soon the iWatch and iTV, sitting below, and working back up to, its 50-week MA?
Of course, there's much more you need to know and many more stocks you can capitalize upon each and every day. To find out more, type in www.markettamer.com/seasonal-forecaster
By Gregg Harris, MarketTamer Chief Technical Strategist
Copyright (C) 2013 Stock & Options Training LLC
Unless indicated otherwise, at the time of this writing, the author has no positions in any of the above-mentioned securities.
Gregg Harris is the Chief Technical Strategist at MarketTamer.com with extensive experience in the financial sector.
Gregg started out as an Engineer and brings a rigorous thinking to his financial research. Gregg's passion for finance resulted in the creation of a real-time quote system and his work has been featured nationally in publications, such as the Investment Guide magazine.
As an avid researcher, Gregg concentrates on leveraging what institutional and big money players are doing to move the market and create seasonal trend patterns. Using custom research tools, Gregg identifies stocks that are optimal for stock and options traders to exploit these trends and find the tailwinds that can propel stocks to levels that are hidden to the average trader.
Related Posts
 Billionaires Warren Buffett and Ken Griffin Both Own This Vanguard ETF. Should You?
Also on Market Tamer…


Follow Us on Facebook