
Following "Black Monday", David Nadig of FactSet offered this observation regarding existing SEC market rules: “It exposed the sledgehammer nature of the tools they gave the markets!”
In August of 2014, we took an extended look at the “Smart Beta” ETF category [https://www.markettamer.com/blog/what-is-smart-beta ; https://www.markettamer.com/blog/getting-high-dividends-with-smart-beta ]. One of the most popular portfolio strategies within the wide range of all available “Smart Beta” choices is “Low Volatility”.
The simplest way to understand how these “Low Volatility” ETFs are constructed is as follows:
The underlying index of each such ETF is composed of the lowest volatility stocks within any given broader universe of equities (U.S., International, or Emerging Markets, for example). Such an index is intended to provide equity market exposure to investors while reducing some of the downside risk inherent within stocks.[1]
As you can imagine, if any strategy (short of being totally out of equities) was ideal for the market environment we have witnessed since mid-August… then “Low Volatility” would be it! One glimpse of the Year-to-Date (as of September 24th) CBOE Volatility Index® (VIX)[2] chart quickly confirms how helpful “Low Volatility” might have been:
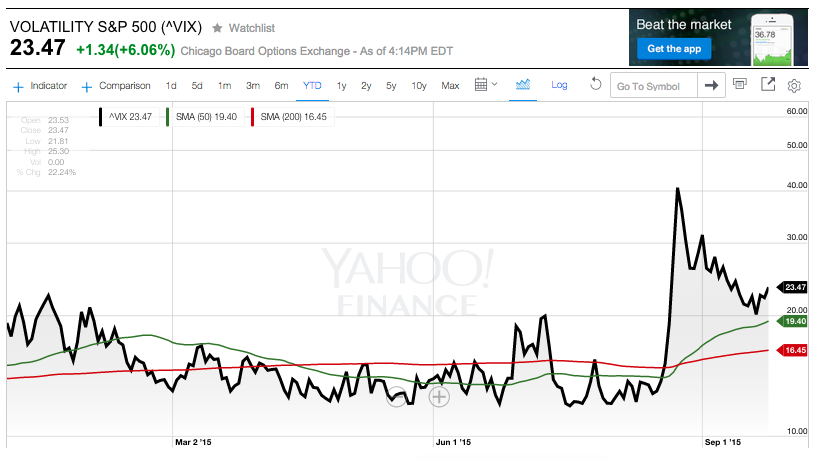
The VIX had been “relatively tame” from mid-March through the beginning of August (note that the 50 period SMA crossed down through the 200 period SMA in March… but moved sharply back up through the 200 period SMA in mid-August). By the end of August, the VIX had experienced an unprecedented upward spike … the closest recent parallel being the volatility suffered in 2008.
Given that I used the term “relatively tame” above, I feel must quickly add the qualifier that 2015 has been a difficult trading year for millions of traders and investors. If the S&P 500 Index was a person being diagnosed by a mental health professional, I would love to read the official report of the diagnosis. (“Indecisive” might be an adjective included in the report… as might be “impulsive”, “undependable”, “anxious”, etc.) Just take a look at the market’s behavior between January and August – with its highly unusual frequency of 50-Day Moving Average crossovers.
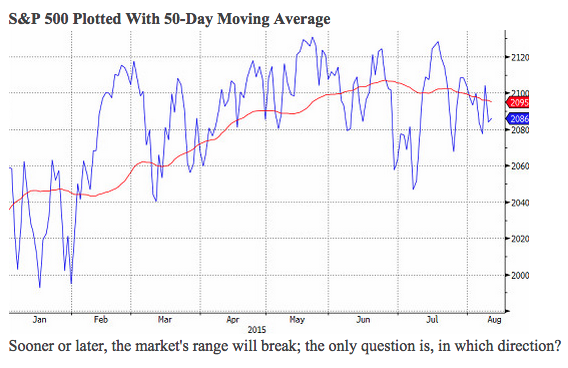 Clearly, until the arrival of August, we had not experienced a dependably “trending” market. Instead, the market frequently “jigged” and then “jagged”… “whipsawing” unsuspecting traders.
Alternatively, consider the number of times the market has become “spooked” by the dreaded “Grexit”[3], the Chinese economic slowdown, the Chinese Yuan devaluation, the Chinese stock exchange meltdown, and/or the omnipresent concerns regarding “Fed Funds Liftoff”[4]… and then suddenly, sometimes mysteriously, seemed to overcome those fears… leaving many of us puzzled (and/or suspicious).
Therefore, I think we can all agree that, in an ideal world that operates in accordance with “textbook” definitions[5] regarding how stock prices should move[6]… either of the biggest and most popular “Low Volatility” ETFs could have been a great choice for inclusion within one’s portfolio:
Powershares S&P 500 Low Volatility ETF (SPLV)
iShares MSCI USA Minimum Volatility ETF (USMV)
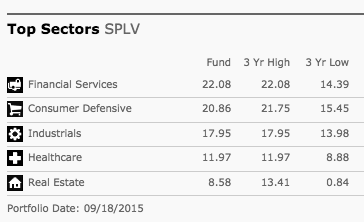
Although the portfolio construction of each of these ETFs is different [see the sector allocations in the Footnotes section[7]], they have demonstrated roughly similar performance:

Did you catch my very intentional wording above: “in an ideal world that operates in accordance with “textbook” definitions[8] regarding how stock prices should move…”??
I included that very broad caveat for one particular reason. In fact, that caveat actually accounts for the very reason that I decided this article needed to be written for you!
Among the many systemic risks that were exposed by “Black Monday” (August 24th) … few were quite as dramatic as the totally aberrant price behavior exhibited by SPLV and USMV. Within the remainder of this article, I am going to focus primarily upon SPLV. However, you should assume that the essence of what I describe herein impacted both of these “Low Vol” ETFs.
The encouraging news about “Low Vol” ETF’s is that, through Friday, August 21st, both SPLV and USMV performed in accordance with what a reasonable observer would expect:
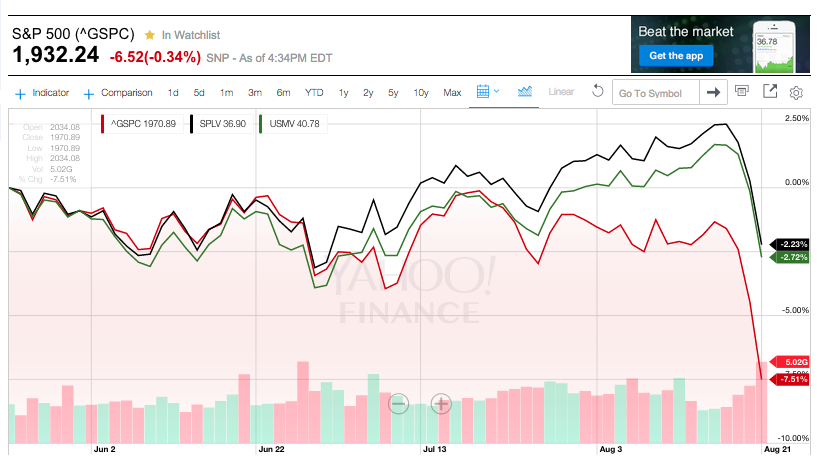
Between the May 2015 high and August 21st, the S&P 500 Index declined 7.51%… while SPLV declined just 2.23% and USMV declined 2.72%!
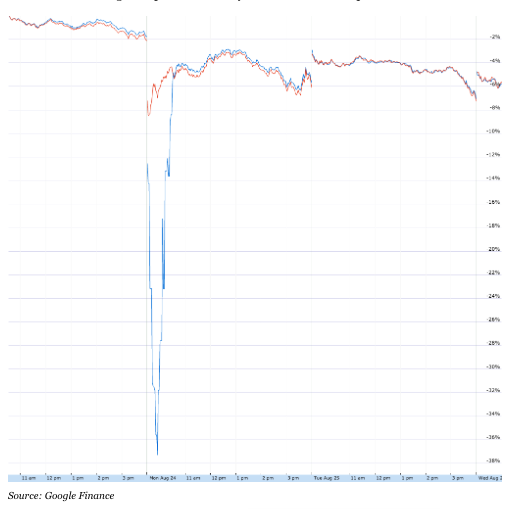
In addition, during the week prior to “Black Monday”, the relative performance of these market indices also conformed to expectations, as evident below:
During the week prior to "Black Monday", SPLV and USMV performed as expected vis-a-vis the S&P 500 Index
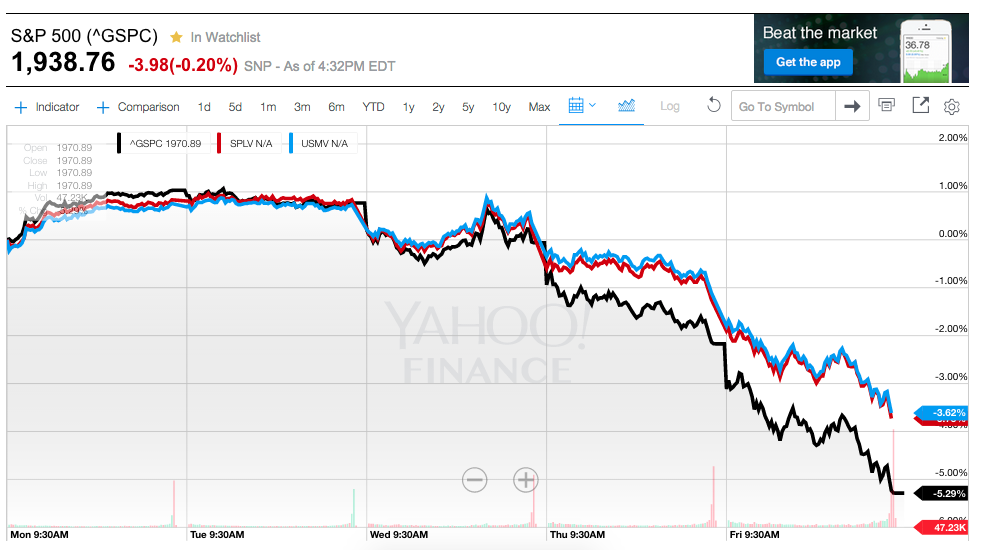
However, as “Black Monday” unfolded, an entirely different, chaotic, and disturbing story unfolded within the markets… perhaps summarized most powerfully in this visual:
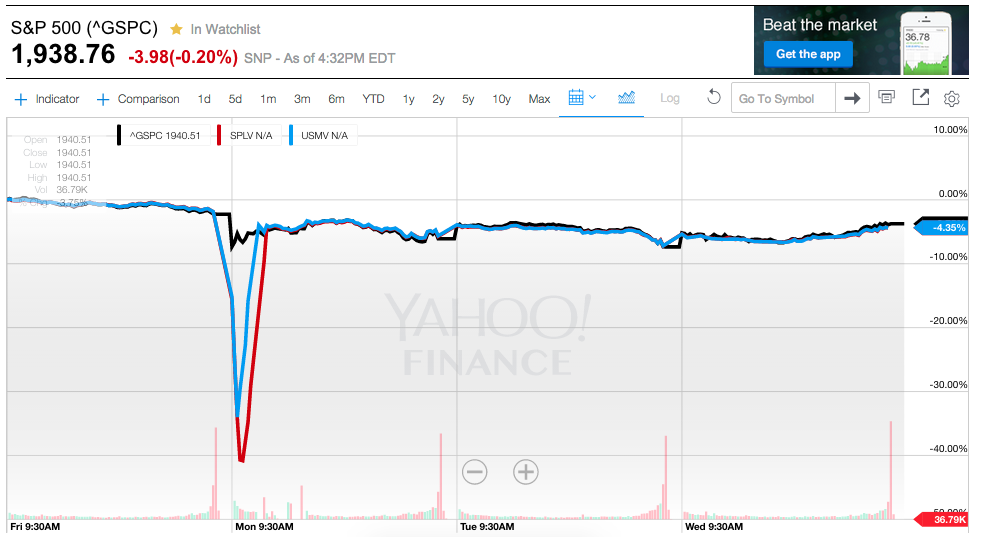
If you take a close look at the scale on the right, you will see that SPLV tanked by as much as 40% on Black Monday — a very scary development for any investor watching her/his “Profit/Loss” summary on a computer screen the morning of August 24th! Such pricing was particularly puzzling, and alarming, given the fact that – at its very worst point on Black Monday – the S&P 500 Index itself was down “only” a bit more than 6.6%!
In the trading world, we talk a lot about “gaps” – but few gaps are as gaping as the difference between 6.6% and 40%!!
So what on earth happened to cause such a crushing disparity between the broad market and these ETFs specifically designed to mute volatility?
The answer begins with the nearly “perfect storm” of factors around the world[9] that had been building to ominous proportions during the days that preceded “Black Monday” – factors which we detailed for readers very recently [ https://www.markettamer.com/blog/could-goethe-and-schiller-have-imagined-black-Monday ; https://www.markettamer.com/blog/could-goethe-and-schiller-have-imagined-black-monday-part-ii ]. To put it mildly, by the time of the normal “open” for the U.S. equity market on the 24th, full-blown panic had set in … and price action resembled a sea of theater goers racing simultaneously for the narrow exit doors after someone yells “Fire!”
The venerable Dow Jones Industrial Index immediately dropped 1,000 points … and visions rushed into investors’ heads of such historical nightmares as October 19, 1987 (just 28 years ago):
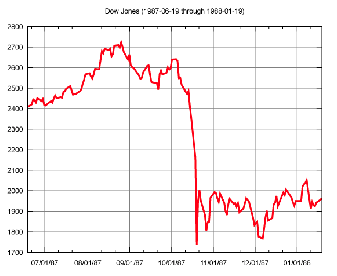
This is the chart from the October 1987 "Black Monday"... when 22.6% of the market’s total value was wiped out in a single day!
and May 6, 2010 (“The Flash Crash” … when $1 trillion in market cap “disappeared” in the course of a mere 36 minutes late that afternoon).
Not surprisingly, various government efforts to mitigate (if not eliminate) such traumatic market volatility were a prime factor in the complex of factors that “went wrong” during August 24th! Most prominent among these catalysts of chaos during August’s “Black Monday” were:
1) Rule 48: this rule was approved by the U.S. Securities and Exchange Commission (SEC) in December of 2007, around the time when U.S. exchanges were shifting from trading based (primarily) on professional specialists to electronic trading.
The intention of Rule 48 was to facilitate “orderly trading” during times of very high market volatility. It was designed to be invoked when such volatility was likely to inhibit the ability of a broad number of “designated market makers” (DMMs) at the NYSE to set opening prices on stocks.
Almost everyone is familiar with so-called market “Circuit Breakers” – a market rule that (when imposed) actually stops trading temporarily in one or more issues, in the expectation that such a trading pause will help market participants act with more reason and order when trading is resumed. Those breakers are often activated within “normal” markets when a particular stock announces totally unexpected news – such as a legal investigation or lawsuit, the resignation of a key officer, or a major revision of prior “guidance”.
Ironically, in sharp contrast to the “pause” mechanism of “Circuit Breakers”… Rule 48 actually speeds up the opening of one or more stock issues by suspending the standard requirement (Rule 123D) that stock prices be identified (“announced”) upon the very open of each trading day.
Take a moment to think about that mechanism within the total context of ETFs on a chaotic day such as August 24th!
Everyone knew that there would be very strong, steep downward price pressure on almost all stocks at the open. Therefore, “price discovery” would be (putting it mildly) a challenge. But trading had to begin at some point, and without any “open” at all… investor sentiment would become even more volatile, and potential investor behavior more chaotic. Therefore, in the interest of facilitating a “more orderly stock market”… the intention of Rule 48 has always been to foster a timely opening of trading (by suspending the requirement of advance price quotes).
However, in the midst of the inevitably chaotic process of “price discovery” on that globally complicated market day … countless issues dropped below the prescribed levels at which “Circuit Breakers” were triggered – temporarily halting trading. In the several accounts that I read about the 24th, well over 1,250 “Circuit Breakers” kicked in … eliminating any hope of trading activity that was even remotely orderly and transparent!
Here is a description of this chaos as expressed by Chris Concannon, the head of BATS Global Markets, in an interview with Reuters:
“At the open, most markets except for the NYSE opened at 9:30, and if you’re trading an S&P ETF and 50 percent of the S&P is not open, you have some pricing challenges on your hands!”
Precisely! Since ETFs are, by definition, merely “baskets” of stocks, the value of any given ETF at any given moment is the aggregate value of its portfolio of stocks! However, when so many of the “underlying” stocks have no precise ascertainable “price”, how can any ETF holding such stocks be accurately priced?
Here is one stark illustration of this point as it impacted the price action of the Guggenheim S&P 500 Equal Weight ETF (RSP) — a stark anomaly that was widely covered within the financial press following “Black Monday”…
The blue-colored "V" shape is the price action of RSP on August 24th. When RSP traded as low as $50, the “fair value” of its underlying stocks never dropped below $71!!!
2) Limit Up Limit Down Rule: this regulatory tool is intended to curtail the trading of any given stock at prices which are beyond a specified range based on recent trading activity. The rule operates by pausing the trading of said stock whenever its price moves outside stipulated limits. The rule was first applied to ETFs in 2013.
Once again, this artificially conceived market constraint … although perhaps positive and constructive within a “normal” trading day (when the rule impacts only a handful of stocks (if any at all))…proved to be extremely inadequate and dysfunctional within the context of systemic, global market turmoil.
It is noteworthy that even the SEC has (for quite some time) recognized that this particular rule does not impact ETFs in the same way that it impacts single stocks. In light of that realization, the SEC instructed U.S. exchanges to propose adjustments to the “Limit Up Limit Down” rule in order to eliminate (or at least smooth out) its negative effects. Even more specifically, the SEC requested that this proposal be developed and submitted to the SEC by October. Obviously, the chaos that was evidenced in August should powerfully motivate the various exchanges and the biggest ETF providers to develop a workable alternative.
Returning to our primary focus – the SPLV ETF – you should by now have a clearer grasp regarding how and why its price graph diverged so far from that of its primary benchmark on Black Monday:

On "Black Monday", the price of SPLV dropped (at one point) over 40%!
To put this situation into oversimplified terms, the out of control volatility that was already present in the global market before the opening of trading in New York on August 24th, combined with “Rule 48”, “Circuit Breakers”, and “Limit Up Limit Down”… led (inevitably) to extraordinary price gaps in quite a number of large-cap stocks that, on a typical day, are “Low Beta” stocks that move significantly less than the average equity security. Those many gaps, in combination with extended periods during the day when trading in multiple stocks held within SPLV was temporarily halted, resulted in disorderly, messy, and inaccurate pricing.
In fact, one of the country’s foremost experts on ETFs – the senior managing director at Canter Fitzgerald, Reggie Browne[10] — said this about ETF pricing on the 24th:

Reggie Browne of Cantor Fitzgerald... a recognized leader within the ETF space.
“We had some really errant prints out there that stood that shouldn't have stood.”
That observation brings to mind that hundreds of errant trades that occurred on May 6th of 2010 (the “Flash Crash”) were later reversed (cancelled). It has been reported that the Vanguard Group (one of the three largest ETF providers) reviewed all of Black Monday’s trades to discern if investors should have received a price different than that reflected within any given executed trade from that day. However, the fact is that no matter how many such trades were mis-priced, there is no recourse for investors who were “wronged” on “Black Monday”. The reason is simple (and ironic). The particular “rule’[11] that applies to this issue is as follows: any ‘Erroneous Trade” must be reported to an exchange within 30 minutes of the alleged mis-pricing!
Here is one more instance of a rule that, although well intentioned, is totally inadequate to meet the needs of investors on a day of widespread global market turmoil such as “Black Monday”! After all, with both trading and digital chaos seemingly the “order of the day” on August 24th… how could any investor (much less the average investor at work) possibly be able to determine what an ETF’s price should have been within just 30 minutes of any given transaction?
I am not a fan of the SEC. It is as much a political body as it is a regulatory[12] agency. For many folks (including myself) a number of its actions and rules seem, a priori, to be contradictory. Consider, for example, some of the rules referred to above that (although they failed on the 24th) were designed to ensure orderly, transparent, and less volatile trading. Then consider both the actual impact upon normal market activity, as well as the impression given to the average investor … of the SEC’s continued support of such controversial items as High Frequency Trading (HFT) and Black Pools. It is crystal clear, for example, that in the midst of the massive chaos prevalent on August 24th… the high speed automated trading inherent within HFT exacerbated the dislocations we have already detailed above.
That being said, it is heartening that at least one commissioner within the SEC has publicly committed to the need for a serious, comprehensive review of what went wrong on August 24th – particularly with regard to ETFs.
Daniel Gallagher has been on the SEC since 2011 (when he was appointed to it by President Obama). This is what he said in a CNBC interview following “Black Monday”:
“Rule 48 went into place in 2007 at a time when you were shifting from specialists into electronic trading here on the floor. It made sense in 2007. Does it still make sense today? We’ll have to look at that.”
Gallagher understands that the world of investing has changed dramatically since 2007. And one of the chief components of “investing change” during that period has been an explosion in the number and market impact of ETFs. Just take a moment to reflect upon these data points:
- Five years ago, there were 950 ETFs; now there are 1,614 ETFs…. An increase of almost 70%!
- Five years ago, 826 billion dollars was invested in ETFs… now the aggregate “Assets Under Management” (AUM) within U.S. ETFs is over $2.1 trillion (per Lipper data)… an increase of over 150%!!
- Total ETF AUM now exceeds the total AUM within all U.S. hedge funds.
- On an “average daily traded value basis” [ie. the actual dollar value of what is traded] ETF trading accounted for 28% of the total daily exchange traded value in June of 2015 (per Credit Suisse)… an increase of 35% compared with June of 2014!
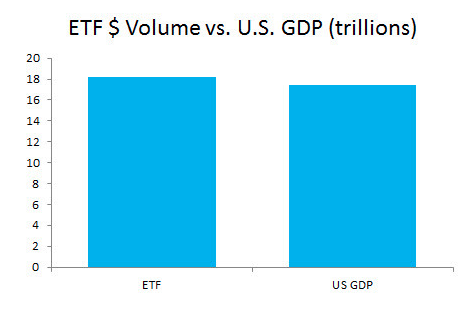
- The trading value of ETFs during the past 12-month period was more than triple that of the ETF trading value one decade ago!
- For a “fun visual”, the above data means that the total ETF trading value during the past twelve months actually exceeded the value of the U.S. Gross Domestic Product (per Bloomberg data).
- The “average annual turnover” in ETFs is now approximately 870% … more than four times the turnover for the average U.S. stock!
- One particularly astounding statistic involves the SPDR S&P 500 ETF (SPY)… that one ETF accounts for fully one third of all ETF trading value (about $6 trillion annualized).
- This equates to $24 billion/day… or more than four times more than any other security traded anywhere in the world…. and (a “fun fact”) more than the next nine most traded equities combined!
- After SPY, two other U.S. ETFs rank among the top four most active global equities on a “traded value” basis:
- The iShares Russell 2000 ETF (IWM) and the Powershares QQQ Trust ETF (QQQ) each trade over $3 billion per day!
- Not insignificantly, the iShares 20+ Year Treasury Bond ETF (TLT) generates an average daily trading value of $1.1 billion… or more than the trading value of banking giant Citigroup (C).
Is there any doubt that the SEC might be at least a little “behind” in adjusting U.S. market regulatory policy to account for these sea changes within the U.S. and global investment markets?
No less an authority than the much respected “Director of ETF Research” at FactSet, David Nadig,

David Nadig
offered this unvarnished characterization of current SEC regulatory policy as it exacerbated market chaos and price-setting irrationality on August 24th:
“It [“Black Monday”] exposed the sledgehammer nature of the tools they gave the markets!”
As we pointed out earlier, even the SEC recognized some time ago that “Limit Up Limit Down” is a regulatory tool that doesn’t work well with ETFs. Unfortunately, the exchanges have not yet disclosed the alternative requested by the SEC. Here, Mr. Gallagher elaborates:

Daniel Gallagher, an SEC Commissioner since 2011.
“We have a discrete issue in the application of the limit up/limit down circuit breakers to ETFs. Do we need to differentiate ETFs from common stock when we look at circuit breakers? Do they operate so differently that they shouldn’t be just lumped in under the same rule?” [The obvious implication is that regulatory revisions are needed.]
So the good news is that at least one SEC Commissioner “gets it”. The bad news is that it was announced a few months ago that Mr. Gallagher will be departing from the SEC at some point in the near future. Here is one more observation from Mr. Gallagher that I will let you interpret as you see fit:
“Markets, this is the way they work. They fluctuate. People get scared when they see these fluctuations but this is the greatness of American capital markets.”[13]
INVESTOR TAKEAWAY
There should be no doubt that the regulatory changes introduced by the SEC since the start of the Financial Crisis in 2007 utterly “failed” their first major test in August on “Black Monday”. On that day, the SEC’s oft-proclaimed goal of facilitating an orderly and transparent market was practically mocked by the overwhelming presence of chaos, confusion, contradiction, and unintended consequences… as well as distress, distraction, and dislocation.
The good news is that breadth and depth of the morning’s absurd discrepancies between ETF pricing and their underlying asset value did slowly narrow as the day wore on. By the close of trading that day, the price/value equation was still not quite restored to “normal”… but it was much improved. Keeping in mind that, at its worst point of the day, SPLV had been down over 40%… it is remarkable that SPLV closed down a mere 5.28% [SPY closed with a more modest loss of 4.2%].
Between the May 2015 U.S. equities high and September 23rd, the “Low Vol” ETFs has demonstrated outperformance vis-à-vis the index (down about 4.5% versus a decline of 8.8% for the S&P 500 Index):
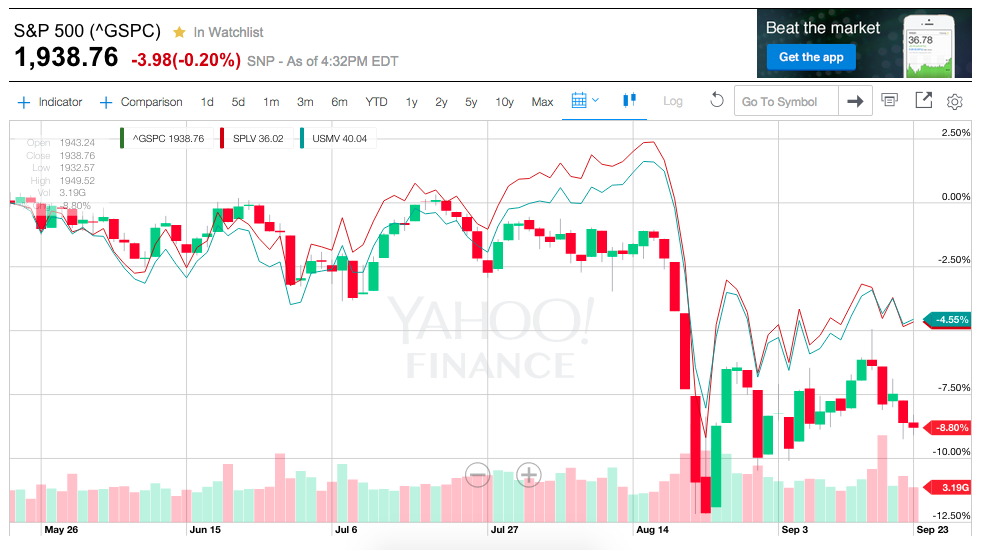
USMV and SPLV (the upper lines) each outperformed the S&P 500 Index (Candlesticks) between the May high and September 23rd.
Therefore, despite the panic of “Black Monday”, complicated and compounded by the “sledgehammer” impact of SEC regulatory tools, “Low Vol” ETFs did confirm their potentially helpful role within investor portfolios … which is why investors have poured over $15 billion into various low volatility instruments, including over $10 billion into the two biggest S&P 500 Index low volatility ETFs.
For those who are interested, here is a down and dirty summary of key recent metrics for SPLV and USMV:
|
METRIC |
S&P 500 Index |
SPLV |
USMV |
| 3-Year Trailing Std. Deviation |
9.59 |
8.79 |
8.24 |
| Sharpe Ratio |
1.61 |
1.67 |
1.83 |
You may want to refer back to our prior articles on valuation in order to more fully grasp the significance of these metrics [ https://www.markettamer.com/blog/market-valuation-watch-for-the-puca ; https://www.markettamer.com/blog/sharpen-your-analysis-of-ibb-xbi-and-fbt ; https://www.markettamer.com/blog/key-information-ratio-for-deciding-between-fcntx-and-rgaax ]. For those who don’t have the time or interest for such review, a simple rule of thumb is as follows:
1) A lower Standard Deviation number means lower volatility.
2) A higher Sharpe Ratio means better “relative” performance.
Let’s wrap up by considering some potential “learning points” based upon the dynamics witnessed within the markets on “Black Monday”. One or more of these points might prove helpful to you as an investor:
1) Entering a “market order” for an ETF can prove to be extremely costly.
- Just imagine how any investor felt if she/he had placed an open “market order” after the close on Friday, August 21, to sell RSP, SPLV, or USMV.
- Not only would they have lost money on August 24th… they wouldn’t even have received a decent fraction of the ETF’s underlying asset value!
- A “limit order” would have spared that investor the disastrous result that many experienced on “Black Monday”.
2) In a similar vein, “stops” can have almost equally unintended consequences.
* A “stop order” is (in effect) a “market order” that is triggered at a specified price point.
* Therefore, virtually any holder of one of the above ETFs who had a “stop” order a few percent below the closing price from August 21st would have been “stopped out” early Monday morning at “heaven only knows what” price below true fair market value!
* I hasten to add that I am not (in any way, shape, or form) advocating that investors do not use “stop” orders. I am merely informing folks of potential “takeaways” from “Black Monday” so all readers are better equipped to make an informed decision about “stop” orders on ETFs.
3) On “Black Monday”, most exchanges opened promptly at the appointed time. The NYSE (as we read above) opened in more disjointed fashion.
* The simple reason for this is that most other exchanges have moved to (almost all) electronic trading.
* In contrast, the NYSE uses professionals on the trading floor to open its stocks/ETFs.
* The theory is that trained persons will provide greater stability to the market system because human judgment can intervene to solve problems in ways that algorithmically programmed computers cannot.
* I fully support that theory… and that system… since I trust persons more than machines.[14]
* However, in the context of the widespread breakdown of “order” within U.S. markets on the 24th, those professionals were (understandably) unwilling to pony up (and put at unlimited risk) their own capital in order to “make markets” in any fashion remotely close to how they function on a normal trading day.
* Therefore, they “stepped away” and the machines and SEC rules took full control.
4) You may not find this helpful… but from the start on “Black Monday”, I realized it was far too late to sell… and far too early to buy… so I took a “deep breath” and just watched in fascination.
* That may sound as though I “wimped out” on “Black Monday”… but I guarantee you that it reflects growth and maturity compared with what I would have done in days gone by.
* In those days I would have felt compelled to “do something”… and invariably, those actions would have generated more losses.
* Panic is never a constructive mental framework within which to trade equities, bonds, or anything else!
And here is one final thought. Since I just learned this myself, I was not in a position to utilize the tip on “Black Monday”. But you may want to file this idea away for potential use during any future experience similar to “Black Monday”.
Assume that, on any given such day, you notice that an ETF such as RSP or SPLV has lost15-30% of its value.
You can check what is called an “Indicative Net Asset Value” for that ETF.
- Go to YahooFinance.com (http://finance.yahoo.com/q)
- In the “Quote” box (at the top of the screen) enter either
- ^RSP-IV or
- ^SPLV-IV
- Or any other ticker symbol… preceded by “^” and followed by “-IV”
- Then hit “enter” or “return”
- The screen will show the “Indicative Net Asset Value”… which can, indeed, be different than the market price at any given moment.
Now, I admit that in the chaos that prevailed on the 24th, that method might not help a lot. As we explained much earlier, “price discovery” on the 24th was quite an adventure. In that case, another tool to try would be to check the price of that ETF’s underlying index or asset.
- For example, for RSP, check the price of the S&P 500 Index.
- If the market price of that index has not wildly run down off the bottom of the screen…. Ie. if it reflects a decline exponentially less than the decline showing at that moment in RSP… you can reason that no lasting disaster has befallen RSP!
- After all, unlike any single company stock, there is no danger of a sudden news event (a CEO being arrested or the FDA rejecting a drug application, etc.) destroying appreciable market value.
- Besides, RSP is an “Equal Weighted” ETF… meaning that its component stocks are even less concentrated (more diversified) than that of the S&P 500!
- Any diversified ETF run by a respected vendor should never lose markedly more value than that reflected within the underlying assets of its portfolio.
DISCLOSURE: The author owns USMV and has formerly owned SPLV and RSP. He also has positions in SPY and many other ETFs. Nothing in this article is intended as a recommendation to buy or sell anything. Always consult with your financial advisor regarding changes in your portfolio – either subtractions or additions.
FOOTNOTES:
[1] To illustrate “Low Vol” Index construction more specifically, this is how the Invesco website describes its underlying index for the Powershares S&P 500 Low Volatility ETF (SPLV): the S&P 500®Low Volatility Index is compiled, maintained and calculated by Standard & Poor's and consists of the 100 stocks from the S&P 500® Index with the lowest realized volatility over the past 12 months… The Fund and the Index are rebalanced and reconstituted quarterly in February, May, August and November.
[2] The VIX is a leading measure of market expectations of near-term volatility conveyed by S&P 500 Index (SPX) option prices. If you want more detail on the many measures of Volatility, see the excellent resource provided by the Chicago Board Options Exchange (CBOE) at http://www.cboe.com/micro/volatility/introduction.aspx
[3] Greek Exit from the Eurozone… which just a few months ago almost every so-called “expert” on CNBC was practically guaranteeing!
[4] An even more interesting psychological diagnosis than one of “the Market” might be a diagnosis of the Federal Reserve Board of Governors (assuming we could analyze its aggregate statements, conjectures, articles, and observations as coming from a single “entity”. Despite the Fed’s protestations that it goes to great lengths to offer the media and the investing public transparent “Guidance” … rarely has there such been a small group of leaders in an economically central and powerful position who regularly contradict one another – leading only to more confusion (and market volatility). I dare say that Dr. Yellen’s most recent performance at the September press conference may have been the most opaque and unhelpful of all of her “post Fed meeting” pressers thusfar!
[5] I refer, of course, to the standard (“classic”) textbook model of the equity market – the Capital Asset Pricing Model (CAPM)… to which we have referred in our articles about valuation and such investment experts as William Sharpe and Robert Shiller.
[6] By which I mean… given relative measures of key metrics such as standard deviation and Sharpe Ratio … among many other measures of valuation and risk.
[7] Here are the “Sector Allocation” slides from the respective websites of these ETFs:
 [8] I refer, of course, to the standard (“classic”) textbook model of the equity market – the Capital Asset Pricing Model(CAPM)… to which we have referred in our articles about valuation and such investment experts as William Sharpe and Robert Shiller.
[9] The volatility witnessed in U.S. markets on Black Monday was mirrored elsewhere – including China (the Hang Seng Index was down 5.2%; while the Shanghai Exchange suffered an 8.5% drop), Japan (the Nikkea sank 4.6%), and Germany (the DAX’s 7% fall drove it into “Bear Market” territory).
[10] Mr. Browne is so influential within the ETF space that he is frequently referred to as “the godfather of ETFs”.
[11] A rule that was updated following the Flash Crash.
[12] The distinction I am trying to hint at is that instead of focusing entirely on the welfare of the “average investor”, as a regulatory body should, the SEC regularly spends as much time pushing politically related agenda items… and/or being co-opted by deep pocket Wall Street lobby interests
[13] I understand what he means, but he might have said it a bit more elegantly. Had this been included in a “stump speech” for political office – it would have been received with extremely mixed feelings by voters!
[14] The “Man vs Machines” dialectic is as old as humankind (a precursor of the dialectic can even be read into the ancient story of Cain (farmer… settled “dweller”) versus Abel (nomadic sheep herder). In modern times, the ongoing “Star Wars” saga and “Terminator” series provide vivid, full-color, theater screen sized portrayals of the man versus machine dynamic.
Related Posts
 Nvidia's New Artificial Intelligence (AI) Chip Could Be the Catalyst to Take the Stock to the Next Level
Also on Market Tamer…


Follow Us on Facebook