Books and articles that claim to identify the true “key” to investment success have been an industry unto itself for many decades. Within these published works, countless insights, theories, principles, and models have been introduced as a “key” (if not the key) to profitable investing. In more recent decades, two of the most popular (and frequently referenced) “models” of investing have been:
1) The so-called “Buffett Method” of “Value Investing” and
2) The modern “Capital Asset Pricing Model”.
Both of these methodologies can be reduced to a formula, which makes it sound as though it is scientific, objective, calculable, and fairly “fool proof”. Alas, it is not in any way “fool proof” – as the “Profit/Loss” statements of many traders utilizing these approaches will attest!!
Lets take a quick look at the formulae revealed in these models:
1) VALUE INVESTING
Quite regrettably, while the name Warren Buffett is recognized by a vast majority of investors (as well as a wide range of U.S. citizens) the name of his mentor/teacher is not widely recognized. That mentor is Benjamin Graham [1]– who wrote one of the great classics of investment literature in1934[2]. In that tome he identified key criteria through which to identify (through fundamental analysis) “under valued” securities, such as a pubic company’s stock that trades:
1) at a discount to book value and/or
2) at a discount to tangible book value and/or
3) has a high dividend yield; and/or
4) has a low price-to-earning multiple; and/or
5) has a low price-to-book ratio.
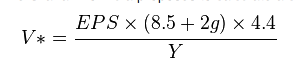
Recognizing that everyone loves a “formula”, Graham offered one in 1934… but revised it 40 years later. The formula was/is intended to suggest the intrinsic value” (“V”) of a company:
 Where …
V: Intrinsic Value EPS: a company’s most recent 12-month earnings/share.
8.5: a constant that represents the appropriate P/E ratio for a no-growth company (per Graham)
g: a company’s long-term (5 years) estimated earnings growth rate
4 .4: the average yield of hi-grade corporate bonds (in 1962, when the model was introduced)
Y: the current yield on 20-year AAA corporate bonds.
Do you “get it” now? Are you fully equipped to proceed triumphantly into the stock market?[3]
If not, perhaps the much heralded[4] CAPM approach will turn the tide for you!!?
2) CAPITAL ASSET PRICING MODEL
Review this marvel of an investment formula[5]:
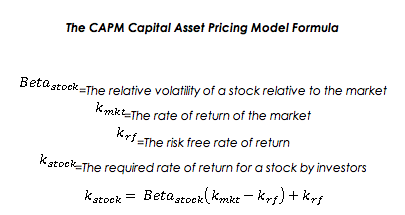
As we can see, the “required rate of return” for any stock is composed of these two elements:
the RISK FREE RATE
and
the RISK PREMIUM
Once the values for the risk free rate and the market rate of return are determined, the required rate of return for all stocks can be easily determined simply by finding the BETA for each stock!
Now that you are equipped with two much-publicized models (with related formulae) ,,, you should be on your way to unfathomable profits… correct?
OK… you guessed it! The above was all a narrative “set-up” to provide a context within which to introduce a quite different approach to investing!![6]
What if there is an established, successful, investment authority who touts the operating premise that successful investing can be boiled down to one of the most elemental premises you learned in Economics 101? Specifically, the operating premise at hand is that we can (largely) throw out all the complicated formulae regarding “value” and (instead) focus upon the dynamics related to “Supply and Demand” within any given potential stock!!
Wow! What a concept!! Invest in accordance with the dynamics we learned in Economics 101!!
Remember this curve? It was in your Paul Samuelson economics textbook![7] It shows how changes in Supply and/or Demand will impact the “Market Clearing Price”. Of course you remember!
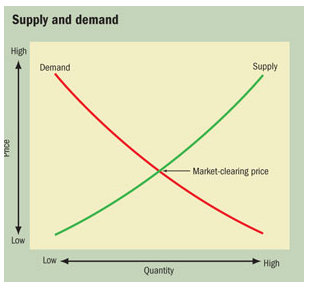
As suggested by this graph, as “Supply” decreases… the price will increase (as long as “Demand” is stable).

Well, in an oversimplified sense, that is the foundational principle of an actively managed ETF named the AdvisorShares TrimTabs Float Shrink ETF (TTFS)!
Yes, that is a very unusual name! Let me dissect it for you:
“Advisor Shares”: is an ETF vendor that specializes in “actively managed” ETFs. In fact, of the actively managed ETFs as of fall of 2013, Advisor Shares is responsible for almost 70% of them! Besides TTFS, the most frequently referenced Advisor Shares ETF has been Advisor Shares Peritus High Yield ETF (HYLD).
“Trim Tabs”: No, this is not a new weight loss product!! Instead, it is the name of an investment company (“Market Trim Tabs”) founded in 1990 (in California) by Charles Biderman (now CEO).
Charles Biderman, Founder and CEO of Trim Tabs.
Biderman chose that name because it refers to an image (“trim tab”) first used by R. Buckminster Fuller to describe how change occurs. A trim tab is the small rudder on the rudder of a capital ship. Although the trim tab’s mass is a tiny fraction of the ship’s mass, movement of the trim tab determines the ship’s course.[9]
“Float Shrink”: this is simply – “A reduction in the number of a publicly traded company’s shares available for trading.”[10]
The key to understanding how Econ 101 ties into simplifying investing (through the TTFS ETF) can be gleaned by reviewing Biderman’s background. According to the Trim Tabs website:
After garnering his BA from Brooklyn College and MBA from Harvard University, Biderman served as the assistant to Alan Abelson, a long-time writer (and former editor) at Barron’s.
Alan Abelson... the Barron's writer for whom Biderman worked after he finished his BA and MBA. Abelson later served as editor.
While with Abelson, he predicted a collapse within the REIT space[11]. After leaving Barron’s in 1973, he became a part of the Wall Street short-selling community – making a practice of commending the short sale of REITs. Once many REITs went belly-up, Biderman moved into arranging real estate deals (especially in Tennessee and New Jersey).
In a textbook case of “mostly right… but not completely right” – Biderman predicted the real estate market would collapse in1988, but he did not foresee liquidity drying up! That meant that there were no readily available funds for development! The result of this miscalculation on his part was personal bankruptcy! However, the “Silver Cloud” was that he learned a crucial distinction (already referred to at the beginning of this article) between “Value” and “Price”:
Value: the intrinsic worth of an asset;
Price: the amount of money that a buyer is willing to pay a seller for an asset.
From that hard won insight, Biderman developed his new investment paradigm: the Liquidity Theory. It was then that he founded Trim Tabs and began digesting and analyzing as much data as he could (such as mutual fund flows and various other market metrics) that could impact liquidity. Once he developed a comprehensive analytical framework to ascertain liquidity, he changed the firm’s name to Trim Tabs Investment Research… becoming an evangelist for the principle that stock prices are a function of liquidity rather than fundamental value!! In 2005 he literally “wrote the book” on his theory:
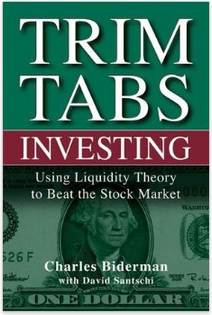
TRIM TABS INVESTING: Using Liquidity Theory to Beat the Stock Market. This is the book Biderman published in 2005.
The ETF that bears his firm’s name was launched in October of 2011. Let’s see how Biderman’s theory has played out within the realm of the real live market:
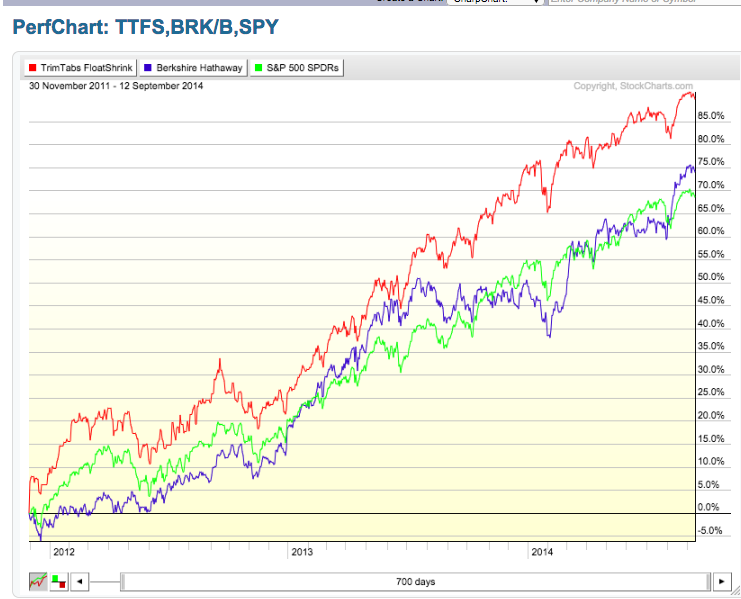
Performance of TTFS since its launch... compared with Berkshire Hathaway B Shares and the S&P 500 Index.
With all due respect to Mr. Buffett, this chart points out that, since its launch, TTFS has significantly outperformed Berkshire Hathaway Class B stock (BRKB in Purple) and the SPDR S&P 500 ETF (SPY: in Lime Green)!!
That said let’s dive into a bit more detail on TTFS. The field of stocks within which Trim Tabs trolls for portfolio candidates is the Russell 3000. Therefore, Biderman has chosen to construct a much broader portfolio than just the 500 biggest market cap stocks! Next, he screens the Russell 300 equity universe for companies that are:
1) Shrinking the float, and
2) Generating free cash flow and
3) Have not issued debt over the prior 120 days. (In other words, he wants the share buyback to have been paid for through internally generated funds![12])
Once that screening process has been completed, the resulting stock list Is trimmed to reduce it to the “Top 100 “… which are then equally-weighted[13] and included within the fund! The ETF makes portfolio adjustments (as appropriate) following announcements of new share buyback programs.[14]
To those who might suggest that a more capital efficient way to return “value” to shareholders is to payout a steadily increasing dividend, Biderman would point out that (at least in a taxable account) share buybacks are a more efficient method on an after-tax basis!
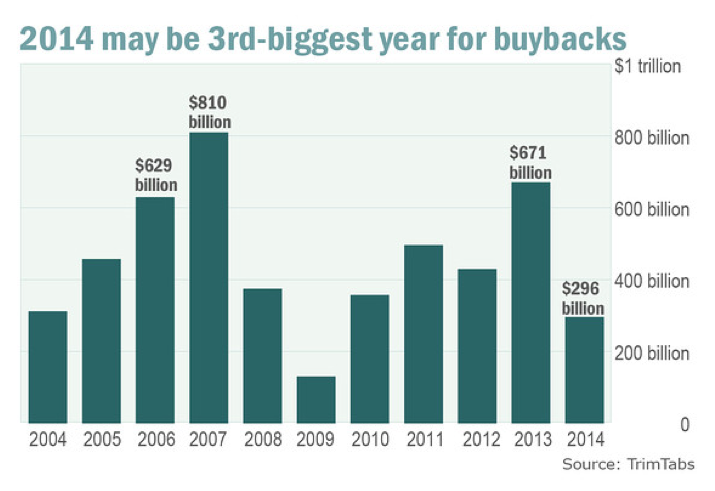
TTFS was certainly brought to market at an auspicious time – since global central bank “quantitative easing” (read that “easy money”) has left corporations awash in cash looking for a productive use! Consider these two graphs of continuing trends within the “share buyback” sphere:
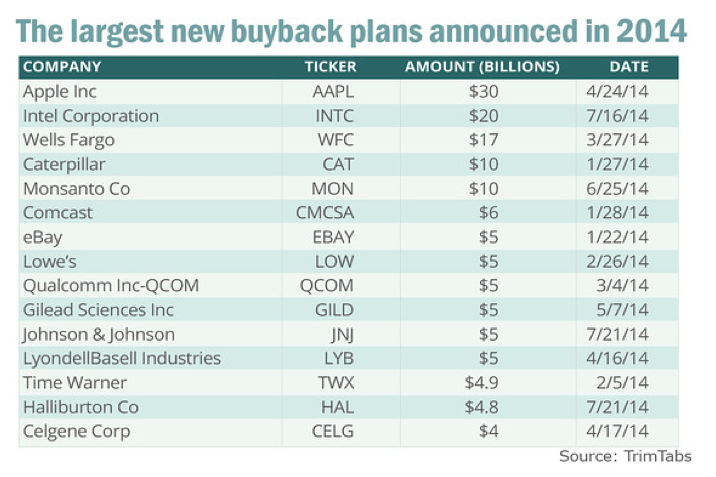 Given all the share buybacks that have been executed and/or will soon be completed, 2014 is projected to be the third biggest year ever for buybacks. Specifically, for the month of July, $55 billion in new buybacks were announced. That was close to April’s $56 billion figure. Thus far during 2014, $300 billion in buybacks have been reported.
What this appears to mean is that while the end of 2014 stock buyback total will likely be less than the $669 billion pulled off during 2013… and less than the all-time record in 2007… it could easily rate as the third highest in history:
TTFS Portfolio Manager, Minyi Chen, recently offered MarketWatch three compelling reasons for the continuing size of buybacks:
1. Financial engineering: By repurchasing shares, companies can maintain or boost their earnings per share, even when their actual earnings aren’t strong. This is a matter of mathematics, since the buyback shrinks the denominator — shares outstanding. Chen observed: “You can call it a little bit of financial engineering…”, but the underlying logic is to bolster its per-share earnings and sustain stock’s momentum.
2. A better way to return money to shareholders: Companies are often criticized for buying back shares instead of investing in equipment or hiring, but Chen suggested that makes as much sense as criticizing dividend payments. Chen opined that a buyback is just another way of distributing corporate profit to shareholders, and it could be seen as a better (and increasingly popular) way of doing so because it avoids “double taxation” that is a downside forcash dividends.
3. Offsetting employees who cash in: Chen said: “A lot of people are criticizing the public companies for being poor market timers!” However, Chen pointed out the obvious fact that, as a stock’s price rises, more employees have stock options that move “into the money”, thereby prompting them to buy shares! A share buyback program helps to reduce the “float” to restore equilibrium!! Conversely, when a stock’s price is descending, there is no incentive to “exercise” the options, so there is no need to restore equilibrium on the “float”.
Many of you will recall that I did an article about another “stock buyback” ETF many months ago:
PowerShares Buyback Achievers Portfolio (NYSEARCA:PKW): This ETF is linked to the Share BuyBack Achievers Index – which incorporates U.S.-listed companies that have repurchased at least 5% of outstanding shares during the past 12 months.
How has TTFS performed vis-à-vis PKW? Here is a graph since the launch of TTFS:
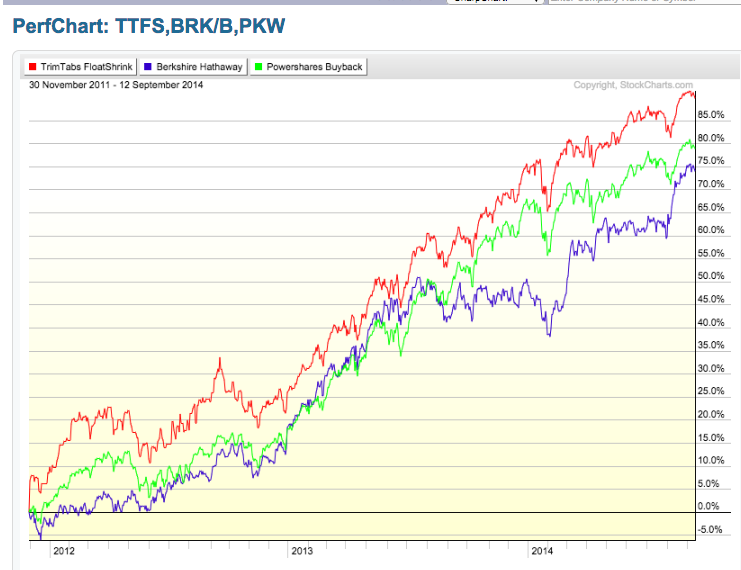
Once again, TTFS shines! Meanwhile PKW does outperform (with all due respect to Mr. Buffett) Berkshire Hathaway!
In light of the above, one has to tip their hat to Biderman for latching onto an investment principle that you don’t need an advanced math degree to understand!! In fact, putting it quite crudely, Biderman likes to compare the stock market to the inner workings of a casino. Specifically, Biderman says that “the house”[15] has an advantage over the investing pubic:
“Top insiders at a company know more about its fundamentals than the investing public. These insiders can influence the price of their shares by timing equity issuance and stock buybacks to their advantage. Our approach simply takes advantage of the opportunity to invest with the house.”
Expanding further on his “Biderman Market Theory”, he says:
“Why guess about intrinsic value? … Minyi and I contend that the prices of stocks are like the prices of any other good, set by underlying conditions of supply and demand. All too many strategists ignore the simple fact that stock prices are a function of liquidity, not value. As long as a company is reducing its float out of free cash flow, but not increasing its leverage, history shows that its price should tend to rise.”
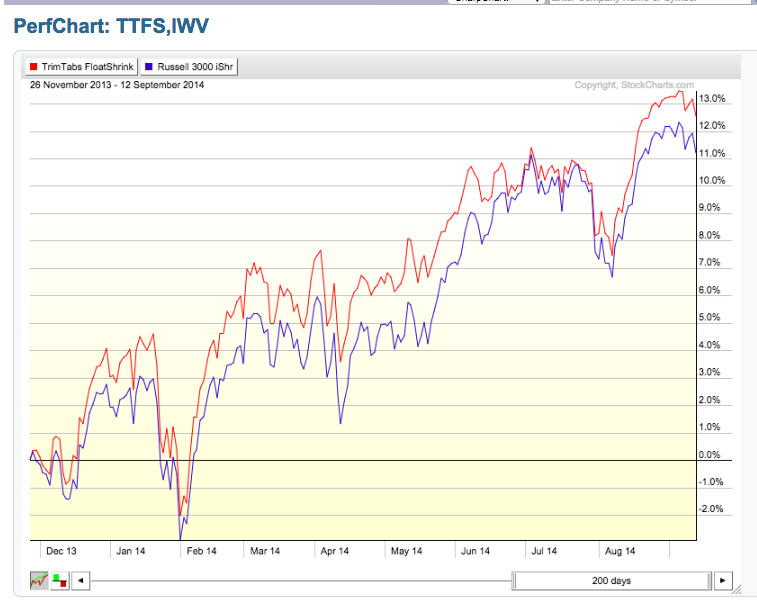
It is worth noting that, since November of 2013, TTFS has outperformed the Russell 3000 Index (IWV), as follows:
 Although a “Top Ten Holdings” list for an “Equal Weighted” ETF is fairly meaningless, these 15 largest weightings in TTFS as of 9/15/14 may give you a flavor of its portfolio:
| Ticker | Name | Price | Market Value | Weight |
| LUV | SOUTHWEST AIRLINES CO |
33.86 |
1681656.9 |
1.13% |
| ASPS | ALTISOURCE PORTFOLIO SOL |
101.79 |
1668338.1 |
1.12% |
| ROST | ROSS STORES INC |
74.95 |
1667862.35 |
1.12% |
| FL | FOOT LOCKER INC |
57.13 |
1643344.45 |
1.10% |
| DG | DOLLAR GENERAL CORP |
63.47 |
1636129.66 |
1.10% |
| RTN | RAYTHEON COMPANY |
101.51 |
1608933.5 |
1.08% |
| STRZA | STARZ – A |
30.57 |
1582150.35 |
1.06% |
| KLAC | KLA-TENCOR CORP |
77.33 |
1556652.9 |
1.04% |
| AET | AETNA INC |
82.12 |
1549604.4 |
1.04% |
| GD | GENERAL DYNAMICS CORP |
126.85 |
1548838.5 |
1.04% |
| NKE | NIKE INC -CL B |
81.61 |
1548549.75 |
1.04% |
| GILD | GILEAD SCIENCES INC |
100.99 |
1544137.1 |
1.04% |
| LOW | LOWE'S COS INC |
53.13 |
1543639.02 |
1.04% |
| ALB | ALBEMARLE CORP |
64.29 |
1542895.71 |
1.03% |
| NTAP | NETAPP INC |
42.865 |
1537138.9 |
1.03% |
Here is one final thought from Biderman regarding what he considers the optimum way for the average investor to utilize TTFS:
Biderman quite frequently suggests that the best way to invest in TTFS is over a minimum 5-year horizon, adding a steady amount of money monthly (dollar cost averaging).
INVESTOR TAKEAWAY:
I consider Biderman to be one of the more intriguing figures within the investment world. He certainly (to shamelessly use a 19th Century literary reference)[16] “marches to the beat of a different drummer!” Unlike Warren Buffett, he can (at times) sound a bit abrasive or “too sure of himself”.[17]
Consider as a case in point an interview televised on CNBC on August 28th of this year:
As you can see for yourself, here are some sobering thoughts from Biderman:
1) Since 2012, there has been an average “float shrink” per month of $45 billion!
2) This has been prompted (in large measure) by the Federal Reserve’s “Zero Interest Rate Policy” (ZIRP)… the result of which is that cash on corporate balance sheets earns “nothing”, which is a steep “opportunity cost”! Therefore, it is better to buy back shares with unneeded cash than to “sit on it”!!
3) Meanwhile, at the end of 2012, the aggregate “Market Cap” of U.S. Stocks was $17 trillion. Today it is $26.5 Trillion… in just 20 months!
A) Many commentators have opined that the real intent of former Fed Chair Benjamin Bernanke (and now Janet Yellen) has been to drive funds into risk assets to help spur (if nothing else) the appearance of economic growth!
B) It would appear that they have been magnificently successful!
4) However, Biderman sees at least one “fly in the ointment”
A) During the past 4 years, Wages/Salaries (subject to withholding) have grown at a tepid 3% per year. The aggregate total is now $7.5 Trillion
B) Meanwhile, stocks have been growing by leaps and bounds (Biderman cites 25% per year). As stated above, equity Market Cap is $26.5 Trillion… about 3.5 times Wages and Salaries.
C) Market Tamer has taught us about “Reversion to the Mean”, correct?
1) Do you think that the stock market getting way ahead of wages/salaries might be an aberration?
2) If it is, a correction could be ahead.
5) In that vein, Biderman offers the (not so) cheery observation that the last two times that the ratio between aggregate market cap versus aggregate wages/salaries was this high included these all too familiar periods: March of 2000 and October of 2007!
That is a sobering thought!
So given the likelihood that a “Reversion to the Mean” is in order (at some point), and the fact that no equity ETF (however “perfect” its approach to investing might be) made much money between 2000 and 2003 or during 2008 and 2009[18], what does Biderman suggest?
Biderman says he is bullish on stocks as long as the same amount of cash (ie. “Demand”) continues chasing a shrinking number of available stock shares (“Float”). So he suggests that the brave among us continue to “ride the tide” and hope one can get out in time!!
Hmmmm! I’m not sure I’m quite that brave! I’d much rather someone alert me when the “Tide” is about to “ride out”. Of course, only the “Market” knows that, and the Market has a long track record of not making that priceless tidbit of information known in advance!
DISCLOSURE: The author owns shares in TTFS. Nothing in this article is intended as a recommendation to buy or sell anything. Always consult with your financial advisor regarding changes in your portfolio – either subtractions or additions.
FOOTNOTES:
[1] One person I quizzed about who Graham was responded that (obviously) he invented the “Graham Cracker”! I laughed. She did not appreciate my laughter!
[2] Security Analysis
[3] With all due respect to Dr. Graham (and to his ubiquitous disciple, Warren Buffett) a basic complication with regard to “Value Investing” is that “Value” and “Price” are (in no way) the same thing! In fact, the reason we have a free, functioning market is that persons interpret “value” and “price” in ways that often demonstrate disagreement (in significant measure!).
[4] and maligned!!
[6] (You found me out… again!)
[7] Or whatever text you used. Samuelson’s was the most commonly used.
[8] HYLD distinguishes itself from the biggest and best known High Yield ETFs (JNK and HYG) through its freedom from the constraints of being limited to “indexed” high yield bonds – which tend to be very large issues! It reports a 30-day SEC yield of 8.16% and a modified duration of 2.46 years.
[9] I’ll forget to add this trivia tidbit to the “Investor Takeaway” section… so remember that you learned this new vocabulary term here at Market Tamer!!!
[10] From Investopedia.com. Also from that source comes this: “Float shrink can occur in a number of ways – through a buyback or repurchase of a company’s shares, an investor acquiring a large stake in a company or even through a reverse split or share consolidation. The term “float shrink,” however, is most commonly associated with share buybacks, since this is a popular way for companies to return cash to their shareholders. A float shrink achieved through a share buyback also reduces the number of total shares outstanding for a company, which has a positive impact on earnings per share and cash flow per share.”
[11] Refers to Real Estate Investment Trusts (REITS)
[12] This criteria would exclude, for example, shares of Apple Inc (AAPPL) or Intel (INTC) following their original announcement of share buybacks… since both companies issued new debt to cover the cost! I note that AAPL has been added because, since then, it has had buybacks that were not directly contingent on new debt!
[13] The ETF’s website states what I have pointed out in several prior articles, namely: “This equal weight approach may help to avoid some of the drawbacks of a market cap weighting, which tends to overweight overvalued companies while underweighting undervalued companies. All 100 of TTFS’s constituents receive the same weighting, no matter their size. This allows TTFS to take profits on outperforming companies and reinvest them in underperforming components.”
[14] The website implies there are no set intervals at which to rebalance: “Float shrink events cannot be predicted before they’re publicly announced. Active management allows TTFS to constantly rebalance and seek to optimize its holdings in an effort to maximize potential return as soon as such float impacting information becomes available. We believe adhering to its proprietary quantitative methodology, TTFS may, under the right circumstances, outperform the broader market.” However, elsewhere it identified that the ETF can trim a position once it has increased by 25% or more.
[15] In this case referring to company management itself.
[16] The reference is to Henry David Thoreau, whose 1854 book, Walden, includes this thought:
“If a man loses pace with his companions, perhaps it is because he hears a different drummer. Let him step to the music which he hears, however measured, or far away.”
[17] During a recent interview with both Biderman and Chen, I was surprised when Chen occasionally dared to qualify or elaborate further on comments Biderman had offered. I happened to agree with Chen; but I sensed Biderman would rather not have been “questioned”. That does not, by the way, invalidate Biderman’s insights. It just means that you have to avoid being put off by his manner!
[18] OK… I grant that if you bought an Inverse Equity ETF… or a leveraged Inverse Equity ETF… at the right time in 2000 (before they were available) or 2008… you could have made money! But I am sure you understood the intent of my statement above…
Related Posts
 Want to Outperform 88% of Professional Fund Managers? Buy This 1 Investment and Hold It Forever.
Also on Market Tamer…


Follow Us on Facebook